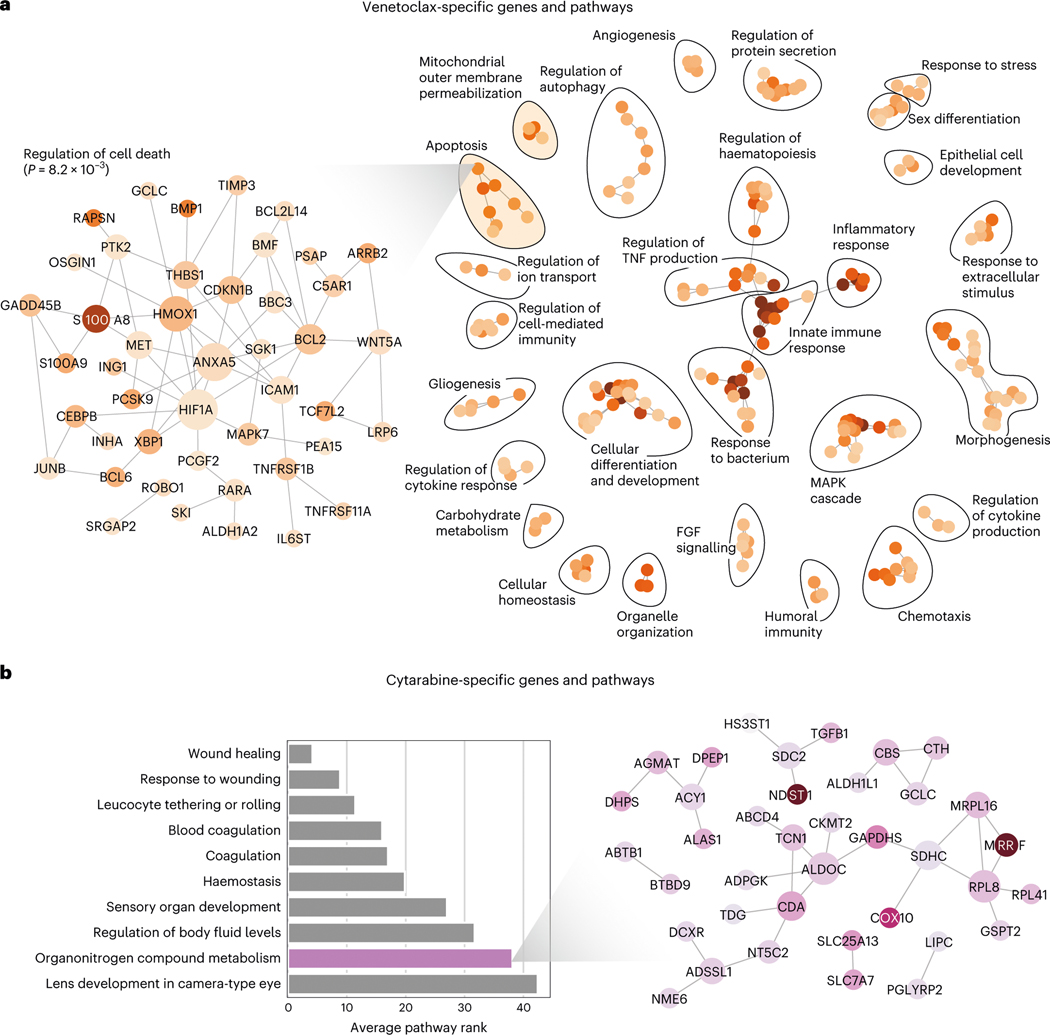
Fig. 6 |. Transcriptomic factors affecting synergy of combinations including specific drugs.
a, The top pathway enrichments in the set of transcripts affecting synergy of drug combinations including the drug Venetoclax. Each node in the graph on the right represents a single pathway, where the colour indicates the strength of the enrichment, and edges indicate significant overlap in terms of the set of genes in each pathway. The zoomed inset graph on the left shows the genes in one pathway, ‘Regulation of cell death’, from the cluster of apoptosis-related pathways. In the left inset graph, each node is a gene, and the edges represent known protein-protein interactions. b, The top pathway enrichments in the set of transcripts affecting synergy of drug combinations including the drug cytarabine. The bar plot (left) shows the top pathways, and the inset graph on the right shows the relevant genes from one pathway, ‘Organonitrogen compound metabolism’.

