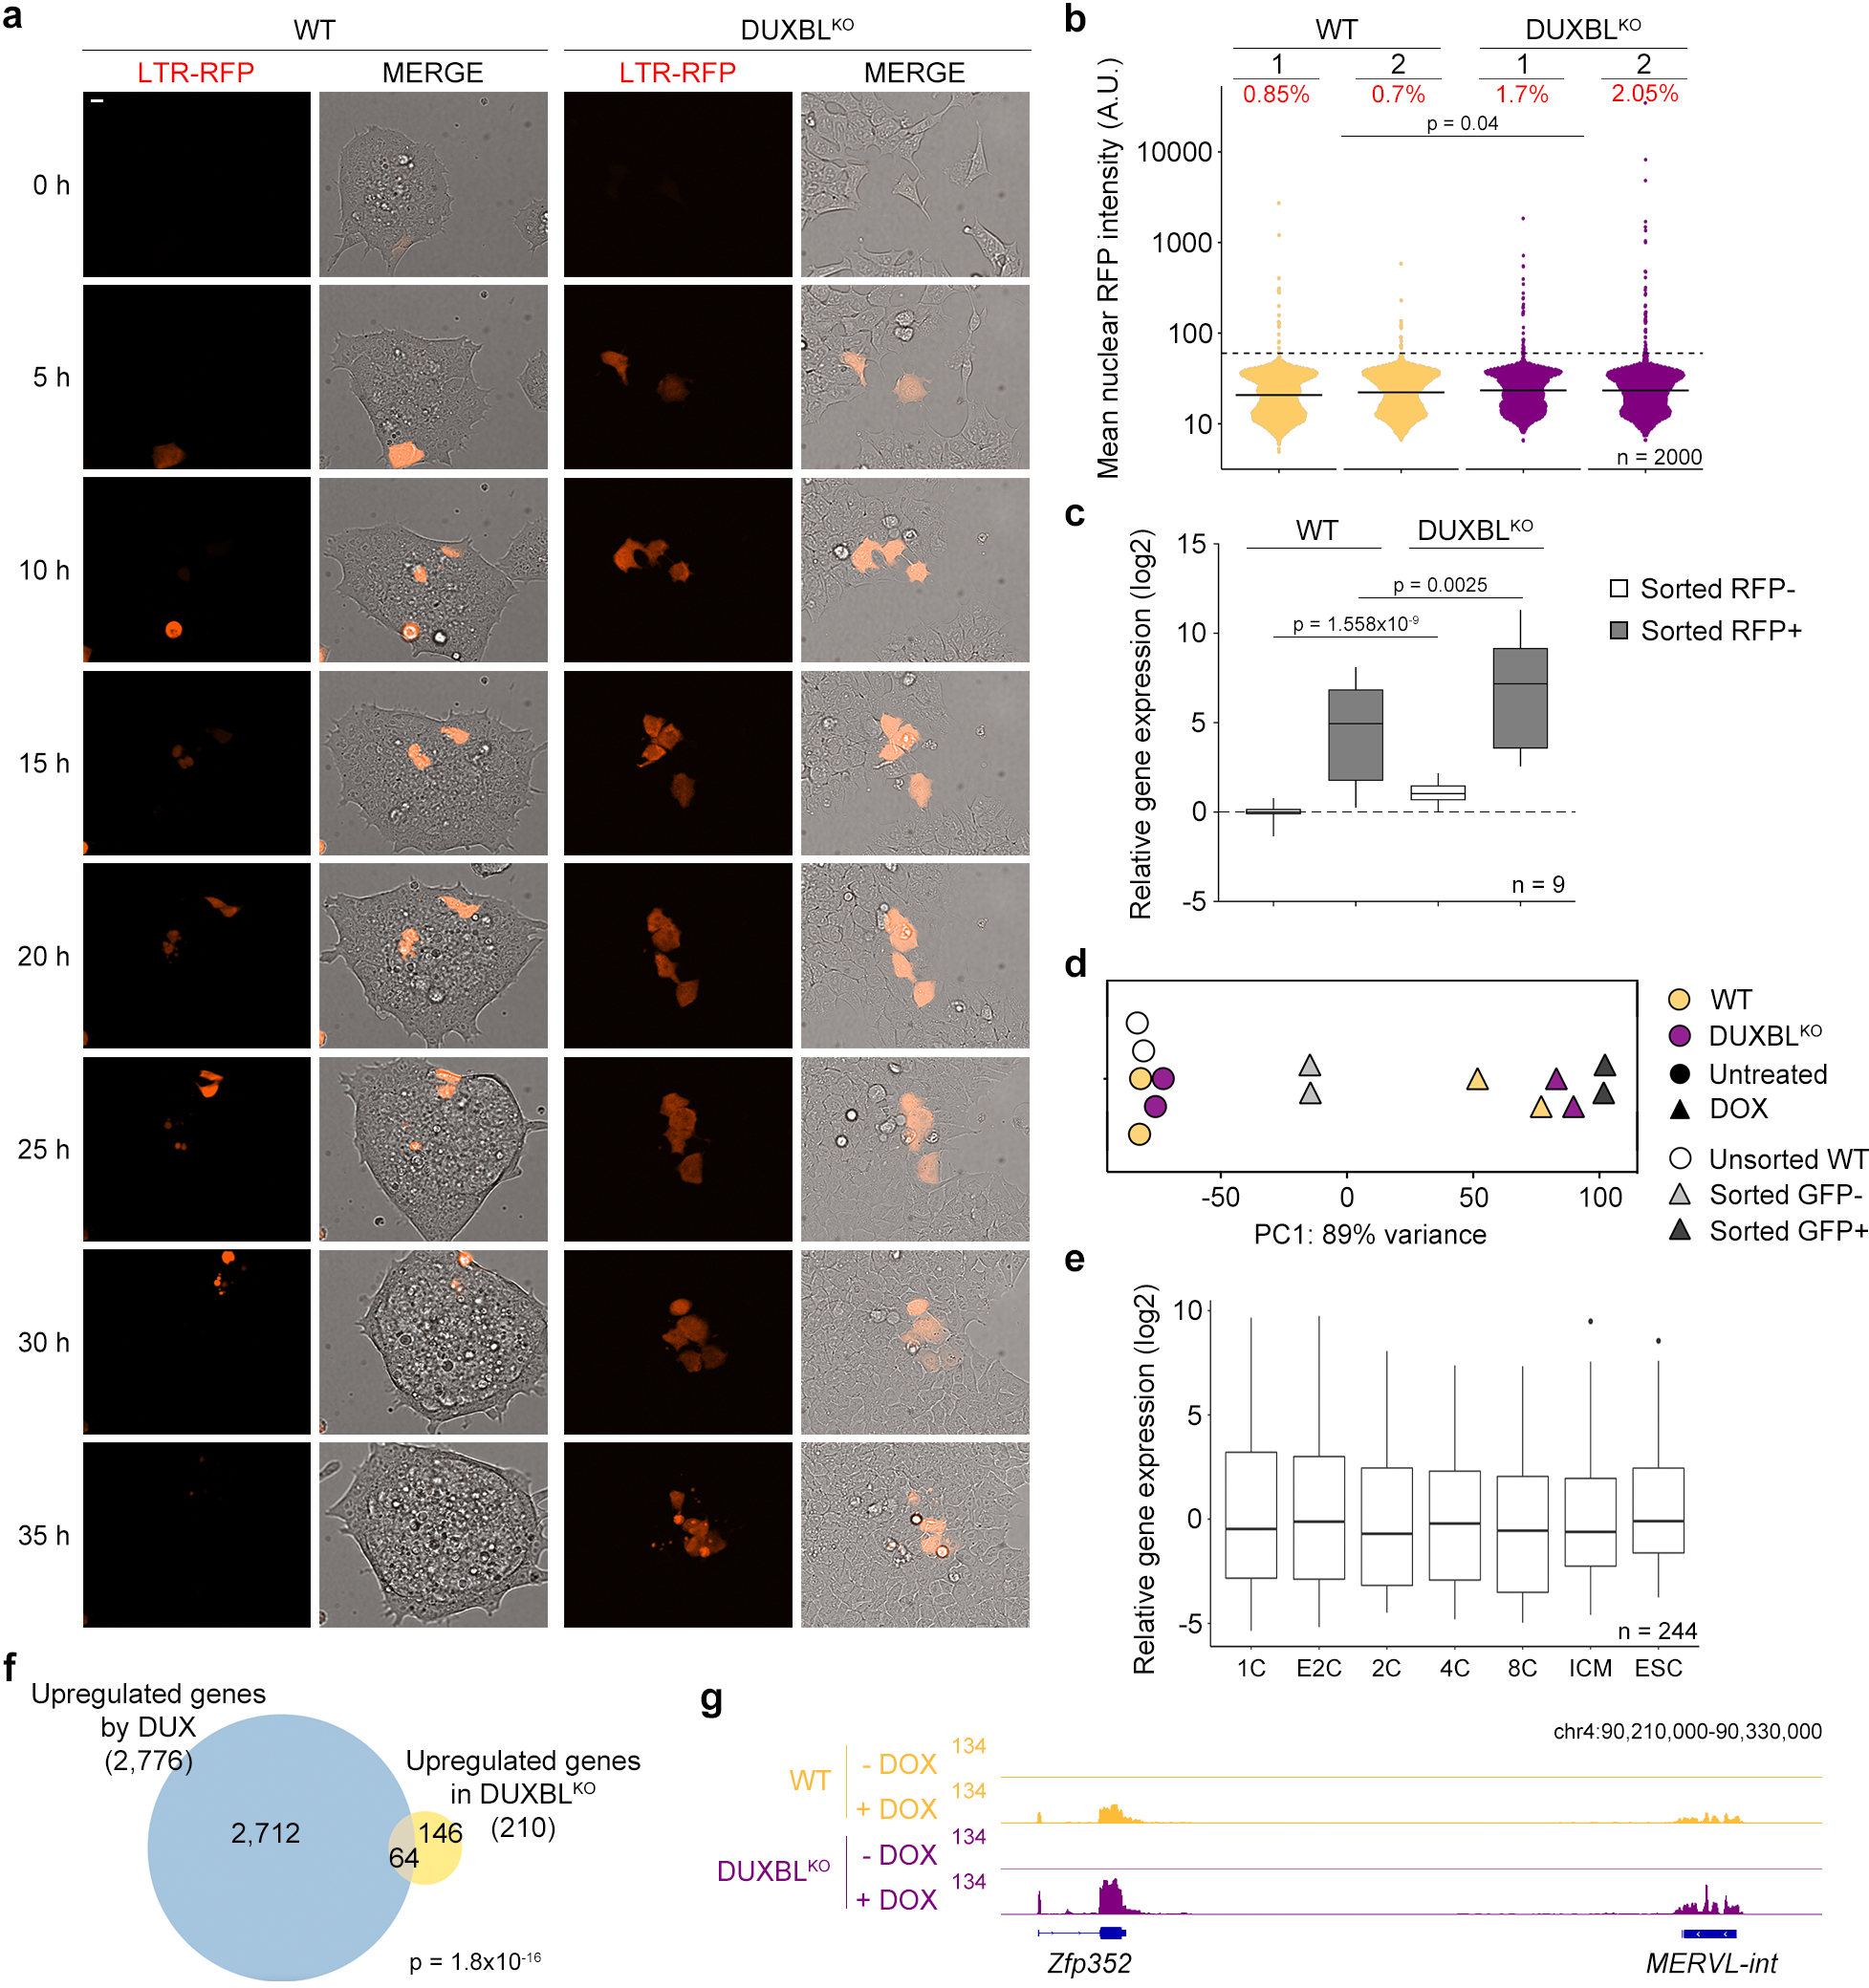
Extended Data Figure 3: Duxbl-deficient ESC showed increased 2CLC-conversion.

a) Time lapse microscopy experiment performed in LTR-RFP reporter WT and DUXBLKO ESCDUX. Two independent experiments with two ESC lines per condition were performed, but one representative is shown. Time since the addition of DOX is indicated. Scale bar, 10 μm. b) High-throughput imaging (HTI) quantification of RFP+ cells in LTR-RFP reporter WT and DUXBLKO ESC. Center lines indicate mean values. Percentages of RFP+ cells above the threshold (dotted line) are indicated. n=2000; p value is from one-tailed unpaired t-test. Three independent experiments were performed but one representative is shown. c) Real time-PCR analysis shown in a box and whisker plot showing the relative fold change expression of nine 2C-associated genes/repeats (Dux, Zscan4c, Zfp352, Tcstv3, Sp110, Tdpoz1, Dub1, Eif1ad8, and MERVLs) in RFP negative, and RFP positive cells sorted from LTR-RFP reporter WT and DUXBLKO ESCDUX cultures. Gapdh expression was used to normalize. Center line indicates the median, box extends from the 25th to 75th percentiles and whiskers show Min to Max values. p values are shown from one-tailed unpaired t-tests. Two independent experiments were performed but one representative is shown. d) Unidimensional PCA plot of RNAseq data from untreated or DOX-treated WT and DUXBLKO ESCDUX (two replicates each) together with WT DUX-expressing ESC from5. DUX-expressing ESC were sorted into GFP+ or GFP- based on the activation of the LTR-GFP reporter. e) Box and whisker plot showing normalized fold change expression of the 244 genes downregulated as shown in Fig. 2b. RNAseq data obtained from27. Center line indicates the median, box extends from the 25th to 75th percentiles and whisker extends from the hinge to the largest or smallest value no further than 1.5-fold from the inter-quartile range. Data beyond whiskers were plotted individually. For (c-e), data was generated using two independent ESC lines per genotype and condition. f) Venn diagram showing the overlap between the 210 genes described in Fig. 2d and the upregulated genes in LTR+ sorted DUX-expressing ESC (data obtained from5). p value was obtained from a two-tailed Fisher’s exact test. g) Genome browser tracks from individual samples showing RNAseq RPKM read count in untreated or DOX-treated WT and DUXBLKO ESCDUX.
