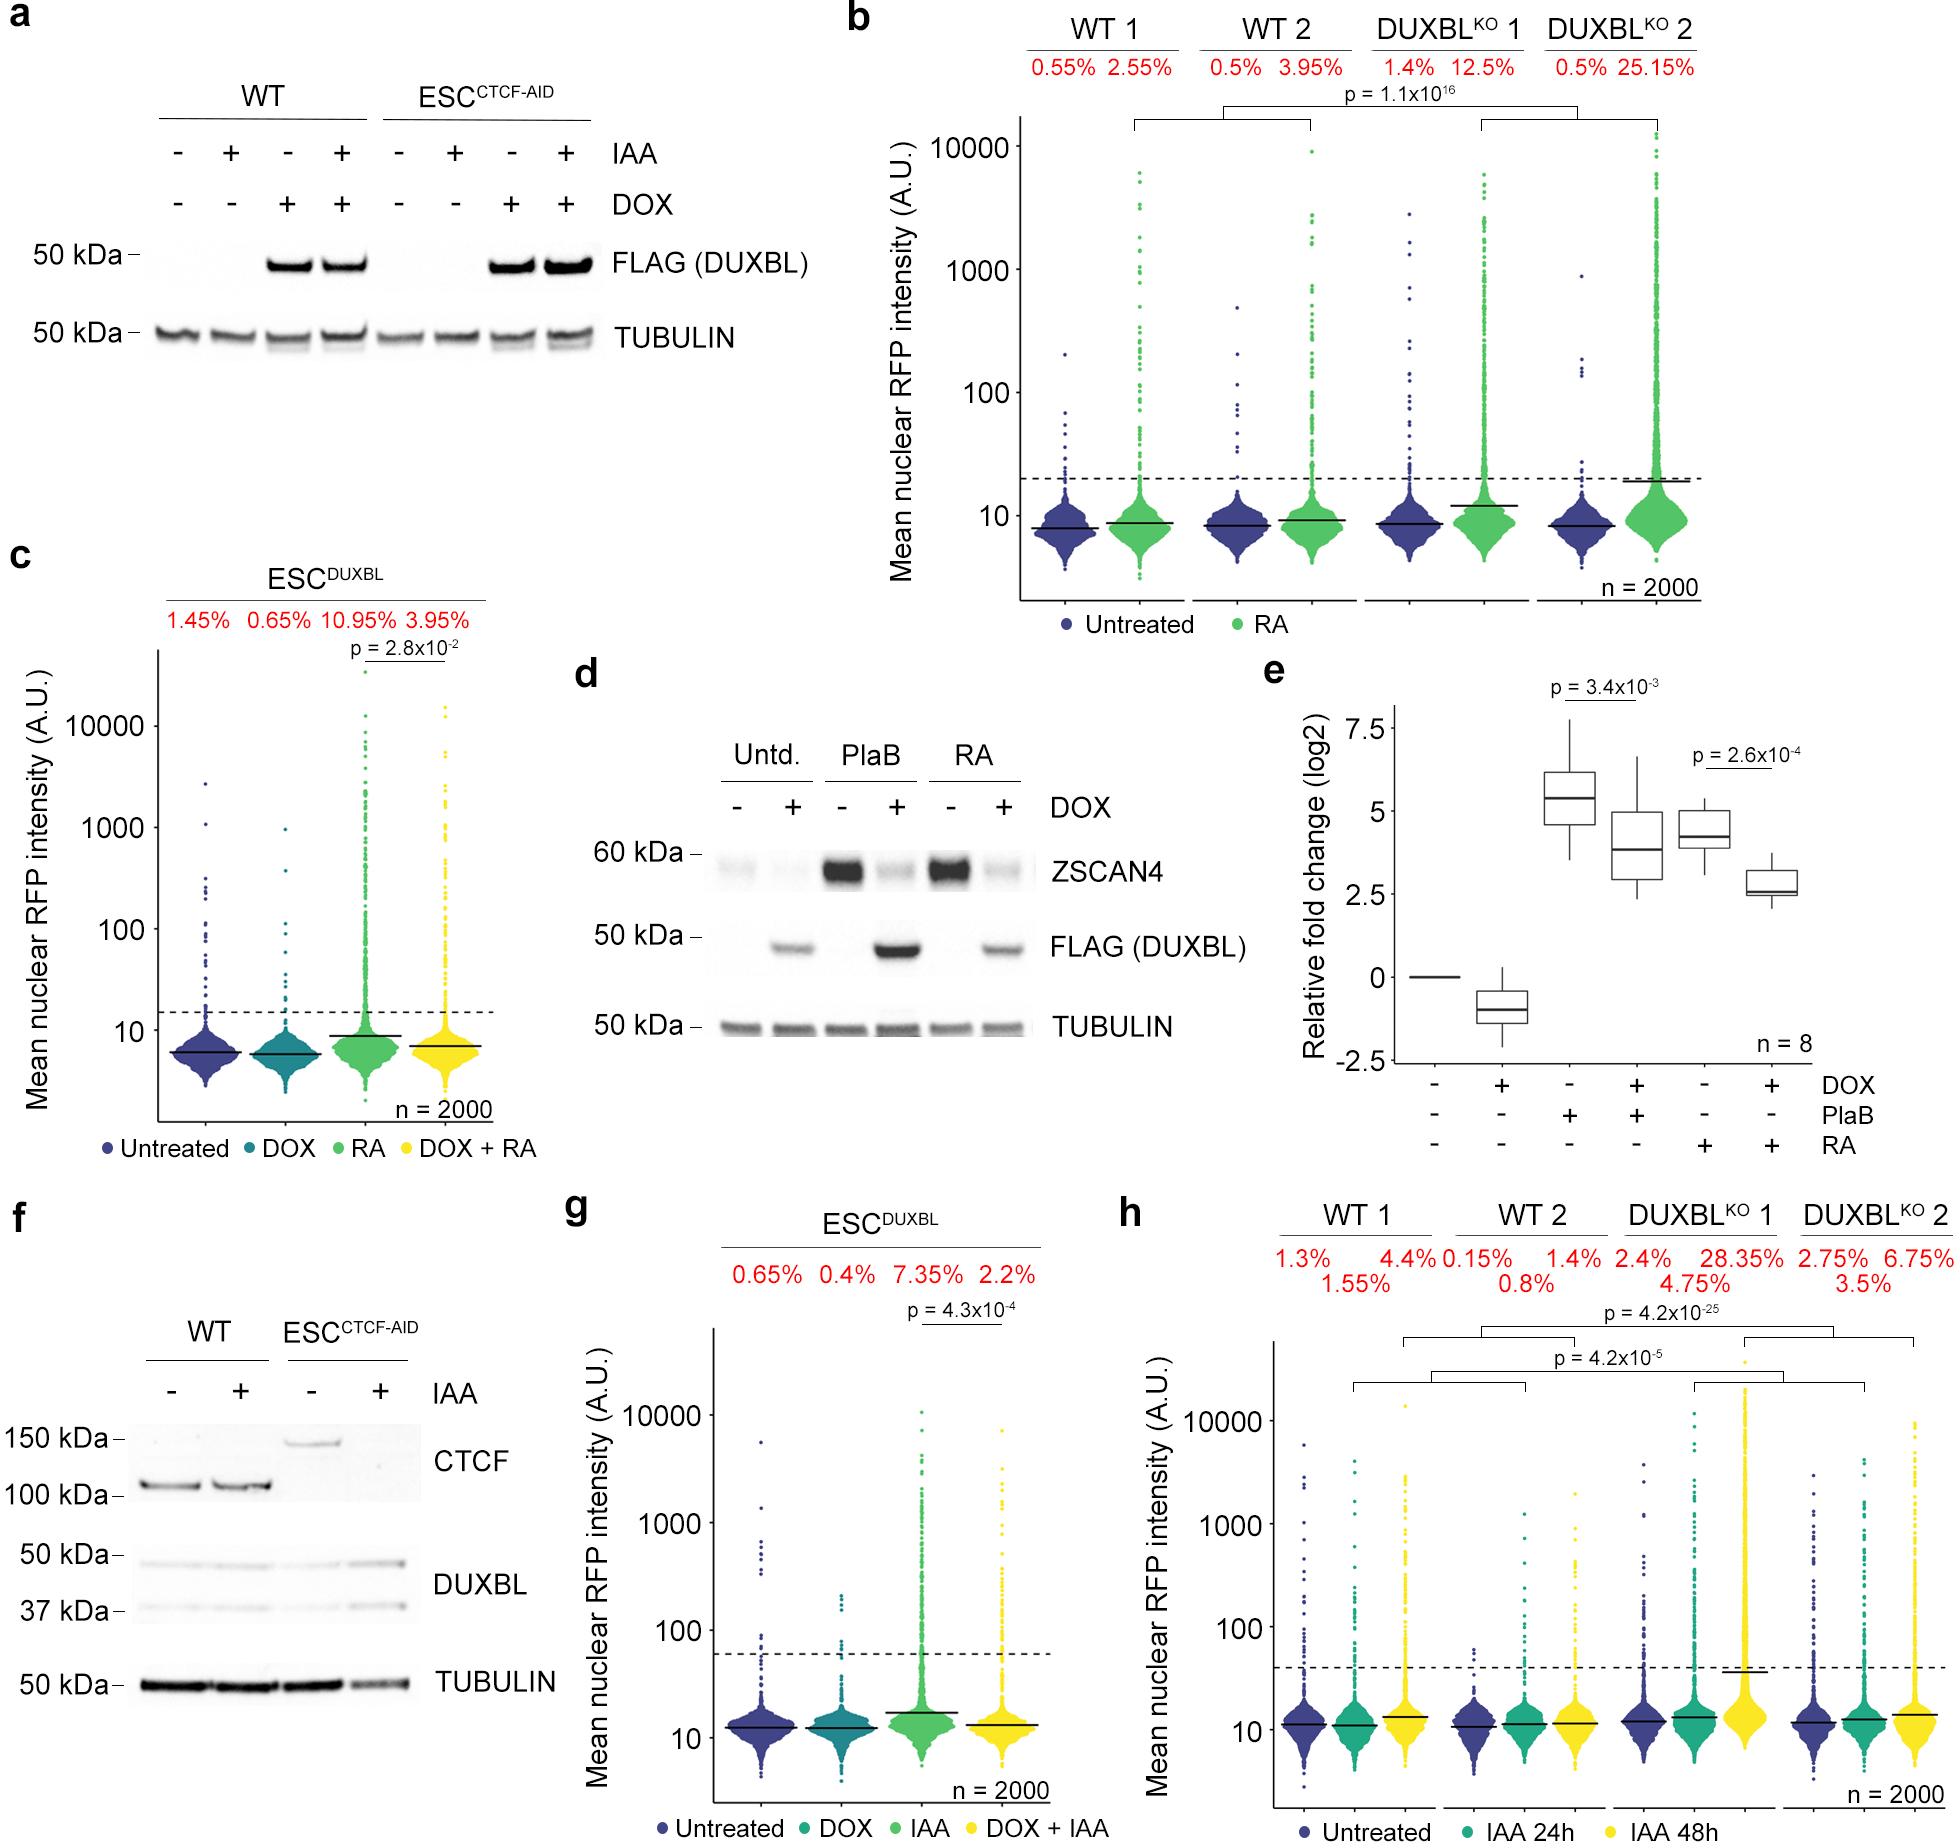
Extended Data Figure 4: DUXBL expression limits 2CLC conversion.

a) Western blot analysis of DUXBL (FLAG) performed in lysates from untreated or indole-3-acetic acid (IAA)/DOX-treated WT or ESCCTCF-AID expressing DUXBL (FLAG). Tubulin levels are shown as a loading control. b) High-throughput imaging (HTI) quantification of RFP+ cells in LTR-RFP reporter WT and DUXBLKO ESC incubated with 0.53 mM RA for 48 hours. c) HTI quantification of RFP+ cells in untreated or DOX-treated LTR-RFP reporter ESCDUXBL incubated with 0.53 mM RA for 48 hours. d) Western blot analysis using lysates from untreated or DOX-treated ESCDUXBL incubated with 2.5 mM PlaB for 24 hours or 0.53 mM RA for 48 hours. e) Box and whisker plot showing the relative fold change (log2) expression of eight 2C-associated genes (Dux, Zscan4c, Zfp352, Tcstv3, Sp110, Tdpoz1, Dub1 and Eif1ad8) in untreated or DOX-treated ESCDUXBL incubated with 2.5 mM PlaB for 24 hours or 0.53 mM RA for 48 hours. Two independent experiments were performed but one representative is shown. p values are shown from one-tailed unpaired t-tests. Center line indicates the median, box extends from the 25th to 75th percentiles and whiskers show Min to Max values. f) Western blot analysis of CTCF performed in lysates from untreated or IAA-treated ESCCTCF-AID. Tubulin levels are shown as a loading control. g) HTI quantification of RFP+ cells in untreated or IAA/DOX-treated for 48 hours LTR-RFP reporter ESCCTCF-AID expressing DUXBL. h) HTI quantification of RFP+ cells in untreated or IAA-treated for 24 and 48 hours LTR-RFP reporter WT or DUXBLKO ESCCTCF-AID. For (a,d and f), two independent experiments were performed but one representative is shown. For (b,c,g and h), center lines indicate mean values. Percentages of RFP+ cells above the threshold (dotted line) are indicated. n=2000. p values are shown from one-tailed unpaired t-tests. In all cases, three independent experiments were performed but only one representative is shown.
