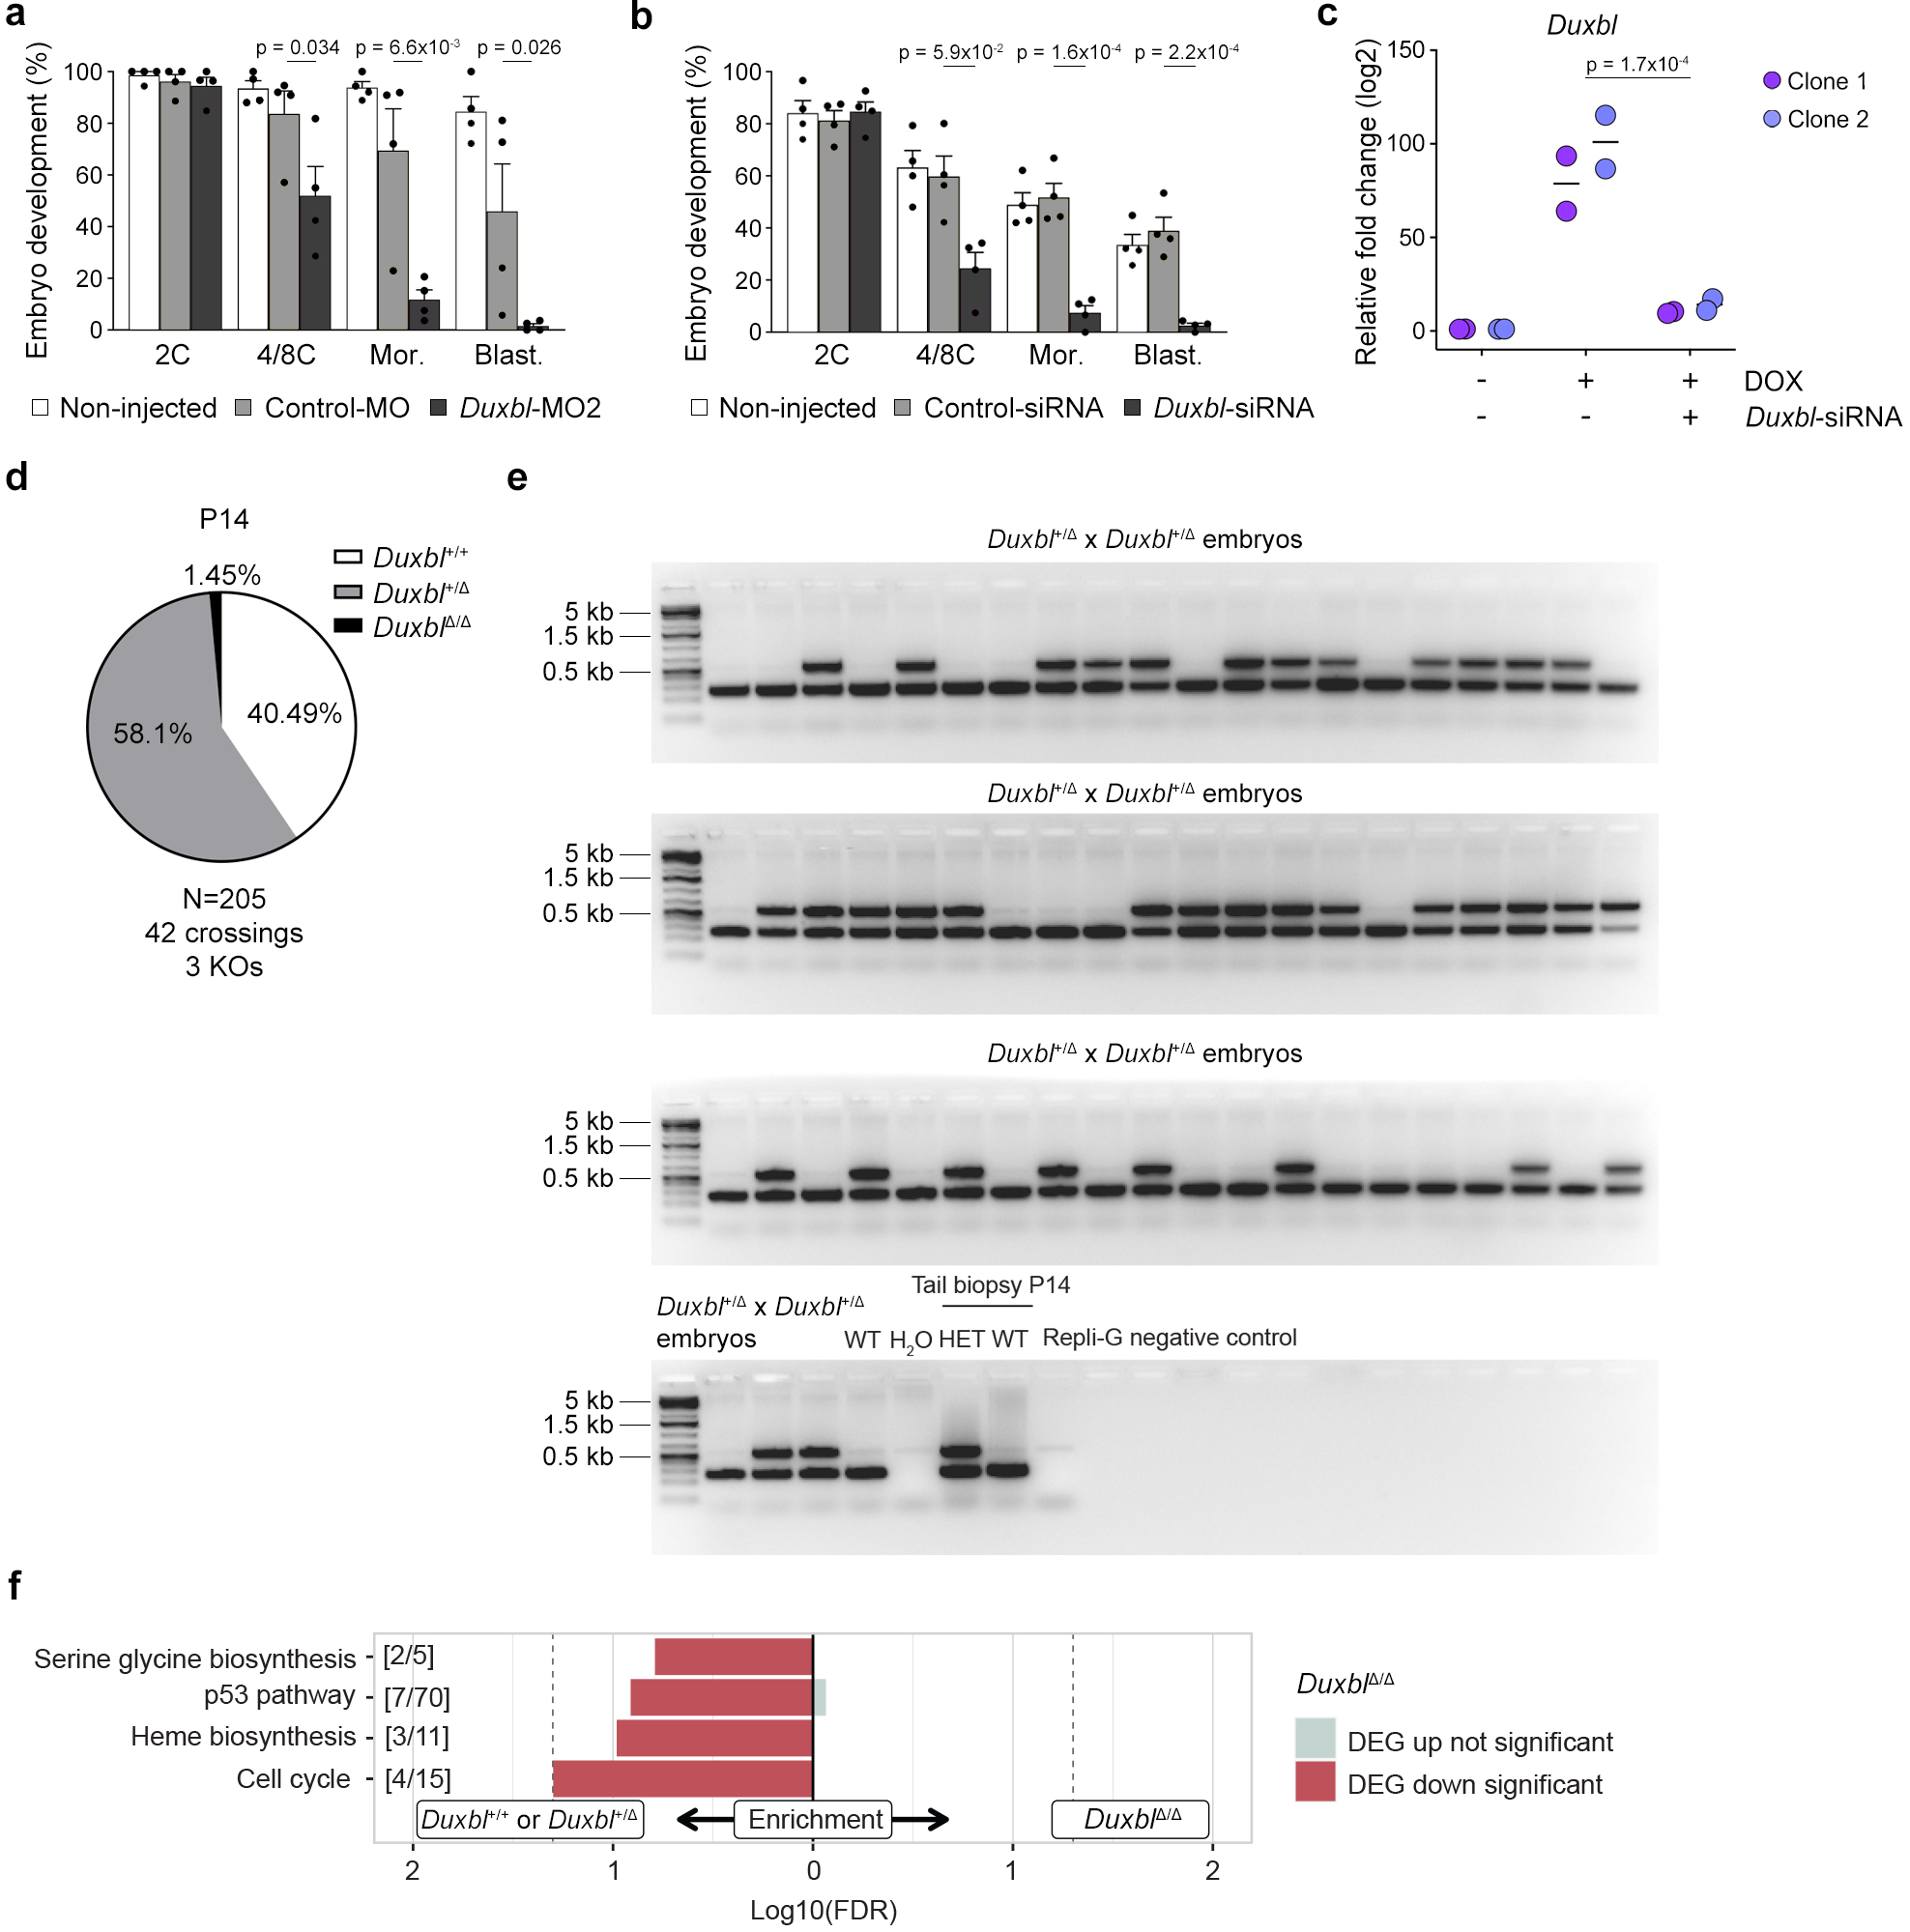
Extended Data Figure 6: Downregulation of Duxbl in zygotes compromises development.

a) Plot showing mean±standard error of the mean (SEM) summarizing four independent experiments with a total of 25–45 microinjected zygotes per group (non-microinjected, control morpholino (MO), or a second morpholino (MO2)-injected zygotes) per experiment. The percentage of embryos reaching each embryo stage is shown. Mor: morula, Blast: blastocyst. p values are shown from one-tailed unpaired t-tests. b) Plot showing mean±standard error of the mean (SEM) summarizing four independent experiments with a total of 25–45 microinjected zygotes per group (non-microinjected, control or Duxbl siRNAs injected GV oocytes) per experiment. The percentage of embryos reaching each embryo stage is shown. Mor: morula, Blast: blastocyst. p values are shown from one-tailed unpaired t-tests. c) Relative fold change (log2) expression of Duxbl in uninduced or DOX-induced in ESCDUX transfected 36 hours prior to induction with the corresponding siRNAs. Reactions were performed by duplicate in two different ESCDUX lines. Two independent experiments were performed but one representative is shown. p value is shown from one-tailed unpaired t-test. d) Pie chart showing percentages of genotypes from Duxbl+/Δ crossings at P14 after F1 generation. e) Gel showing PCR results from genotyping all 8C-stage embryos obtained from Duxbl+/Δ crossings. The identity of the bands obtained by PCR was confirmed by genotyping on positive and negative controls at least two times. f) Gene set enrichment analysis (PANTHER gene sets) according to differentially expressed genes observed in Duxbl Δ/Δ embryos compared to Duxbl+/Δ/Duxbl+/+ embryos (Kobas FDR < 0.2).
