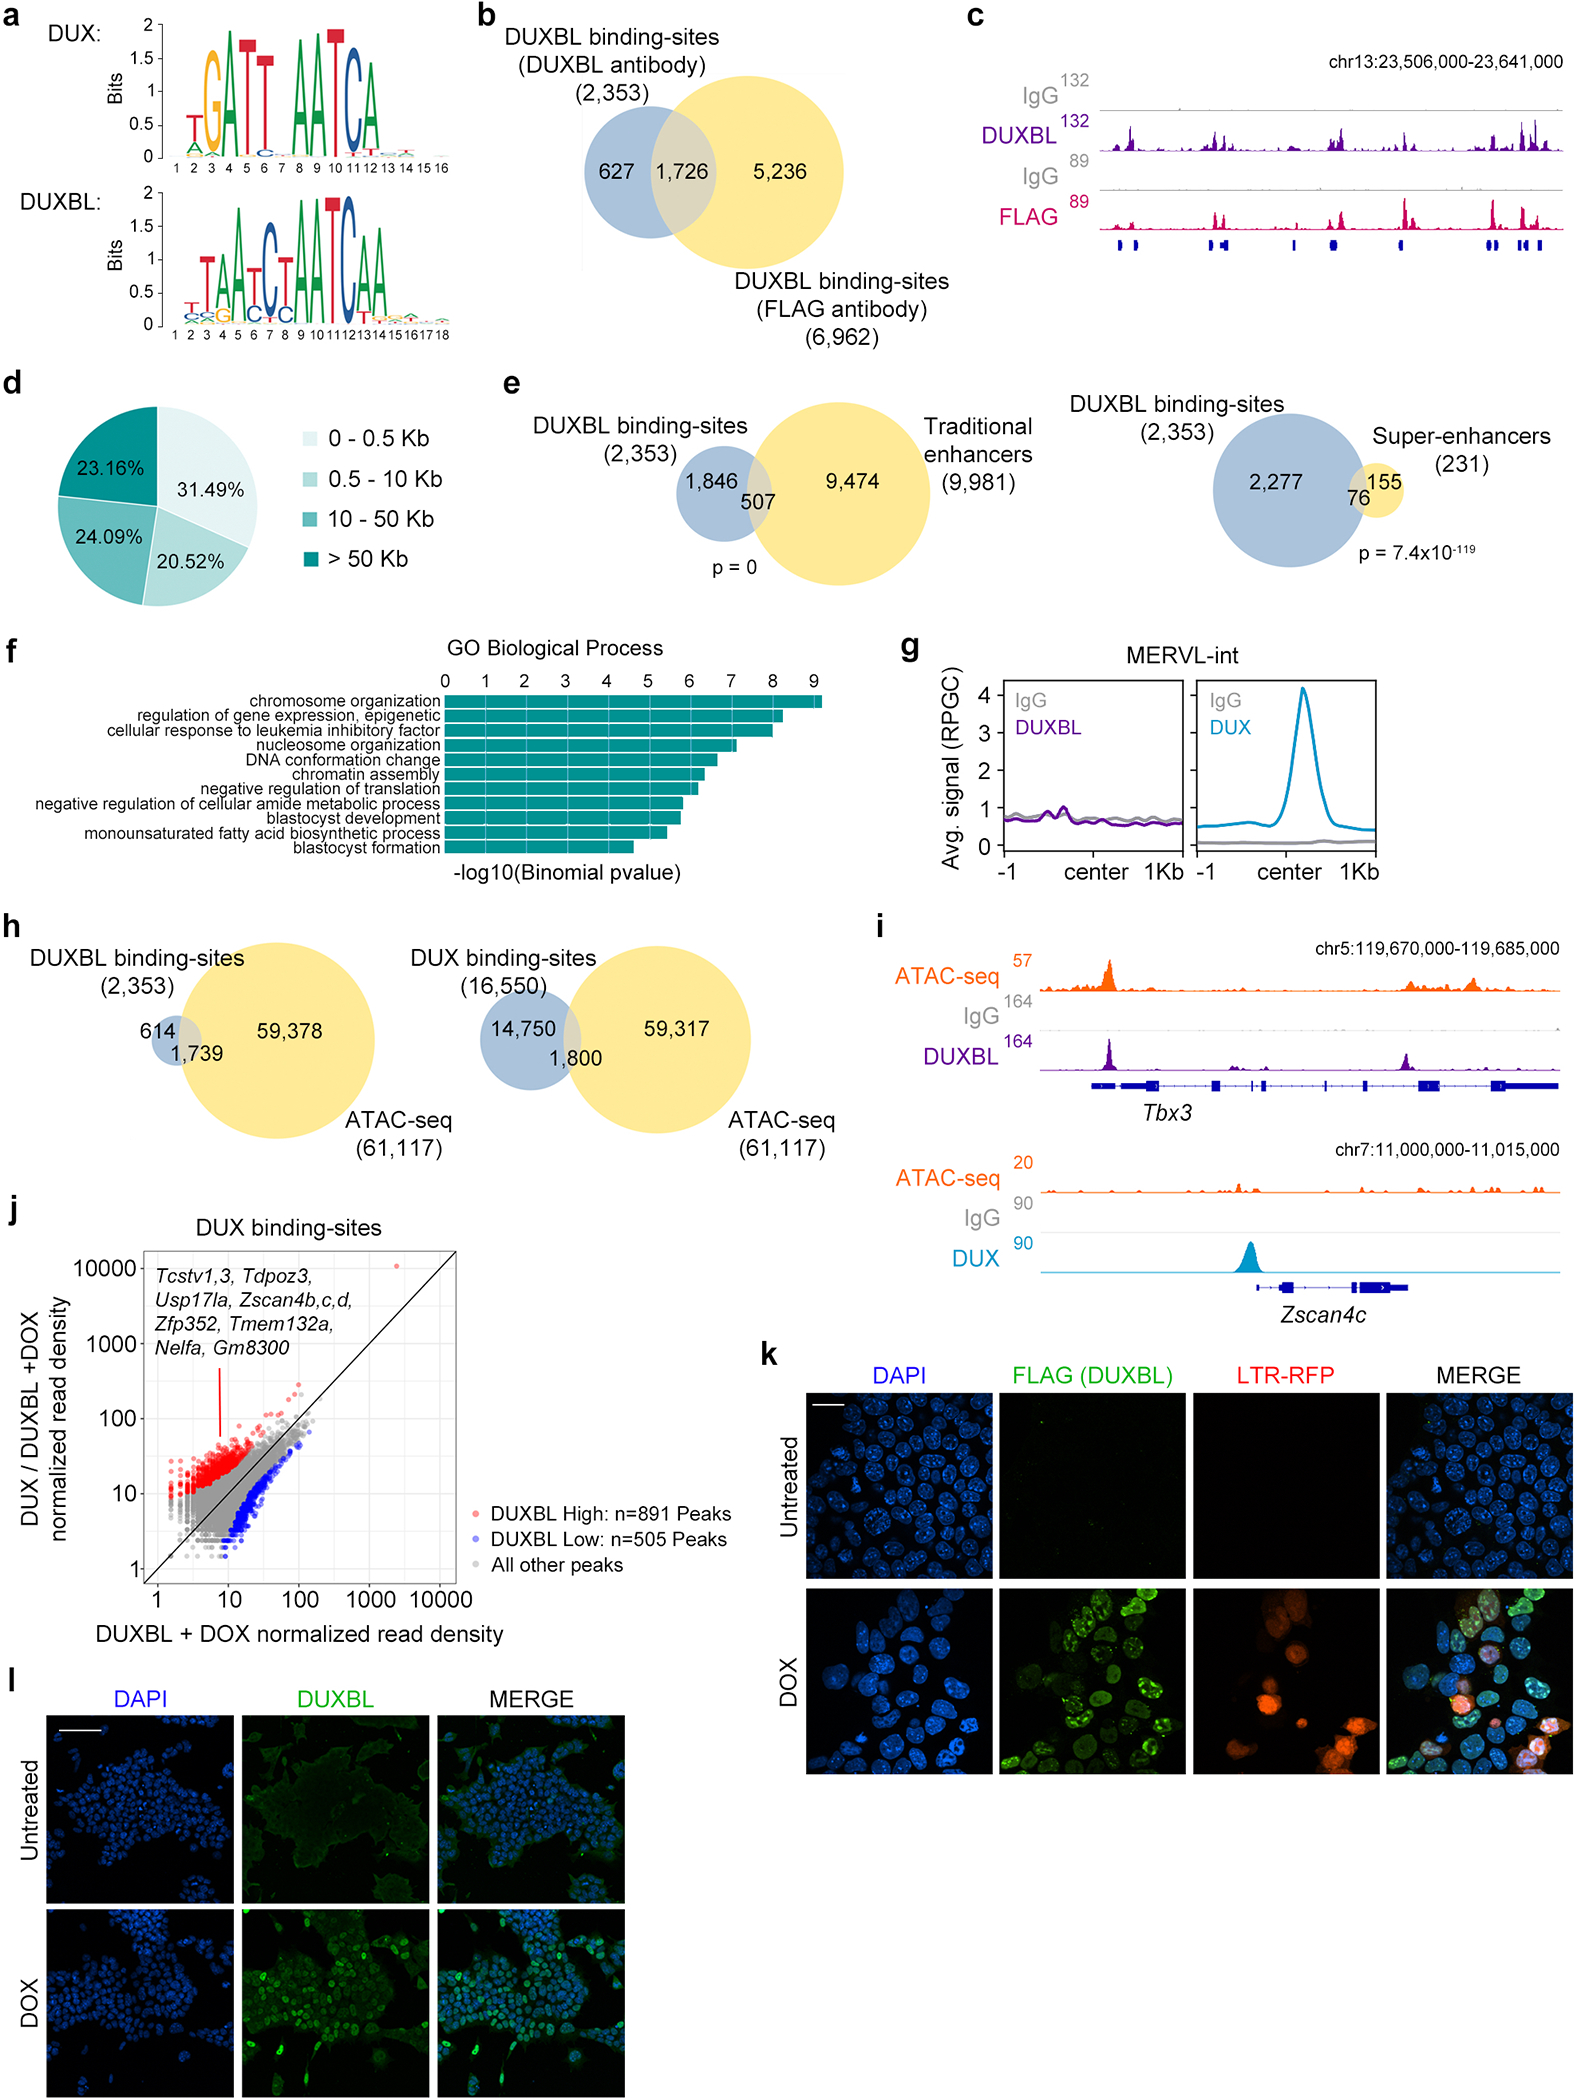
Extended Data Figure 7: DUXBL gains access at DUX-bound sites following DUX expression.

a) Predicted binding sites for DUX and DUXBL (Jaspar database). b) Venn diagrams showing the number of DUXBL peaks overlapping between those identified with DUXBL antibodies (blue) and FLAG antibodies (yellow) in ESCDUXBL. c) Genome browser tracks corresponding to individual samples from (b) showing DUXBL occupancy. Input (IgG) is shown as control. For (b,c), two independent experiments with two independent ESC lines were performed. d) Pie chart showing the genomic distance of DUXBL peaks from gene TSS. e) Venn diagrams showing the number of DUXBL peaks overlapping with traditional ESC enhancers (left) and ESC super-enhancers (SE, right). Enhancer data obtained from31,32. p values shown are from two-tailed Fisher’s exact test. f) Gene ontology (GO) terms obtained from analyzing DUXBL peaks. p-values were obtained from a binomial test. g) CUT&RUN read density plot (RPGC) showing DUXBL and DUX enrichment at MERVL-int elements in DOX-treated ESCDUXBL. Data from DUX-expressing ESC was obtained from5. Input (IgG) is shown as control. Data from one representative ESC line is shown. h) Venn diagrams showing the number of DUXBL (left panel, blue) and DUX peaks (right panel, blue) overlapping with accessible regions in ESC (yellow). ATAC-seq data was obtained from33. i) Genome browser tracks from individual samples showing DUXBL and DUX occupancy as well as ATACseq signal in DOX-treated WT ESC expressing DUX or DUXBL. Data from DUX-expressing ESC and ATACseq experiments were obtained from5,33. Input (IgG) is shown as control. j) Plot showing DUXBL enrichment over DUX-bound sites in the condition of DUX/DUXBL co-expression compared to only DUXBL expression. We used a |og2(FC) cutoff of >1 and p-value <0.01 to define differentially enriched sites. Representative genes in proximity to DUX-bound sites enriched for DUXBL binding are shown. Two independent experiments using one ESC line were performed but data from one representative experiment is shown. k) Immunofluorescence analysis of DUXBL (FLAG) in untreated or DOX-treated LTR-RFP reporter ESCDUXBL/DUX. Scale bar, 20 μm. l) Immunofluorescence analysis of DUXBL in untreated or DOX-treated ESCDUXBL. In (k and l), two independent experiments were performed but one representative is shown. DAPI was used to visualize nuclei. Scale bar, 100 μm.
