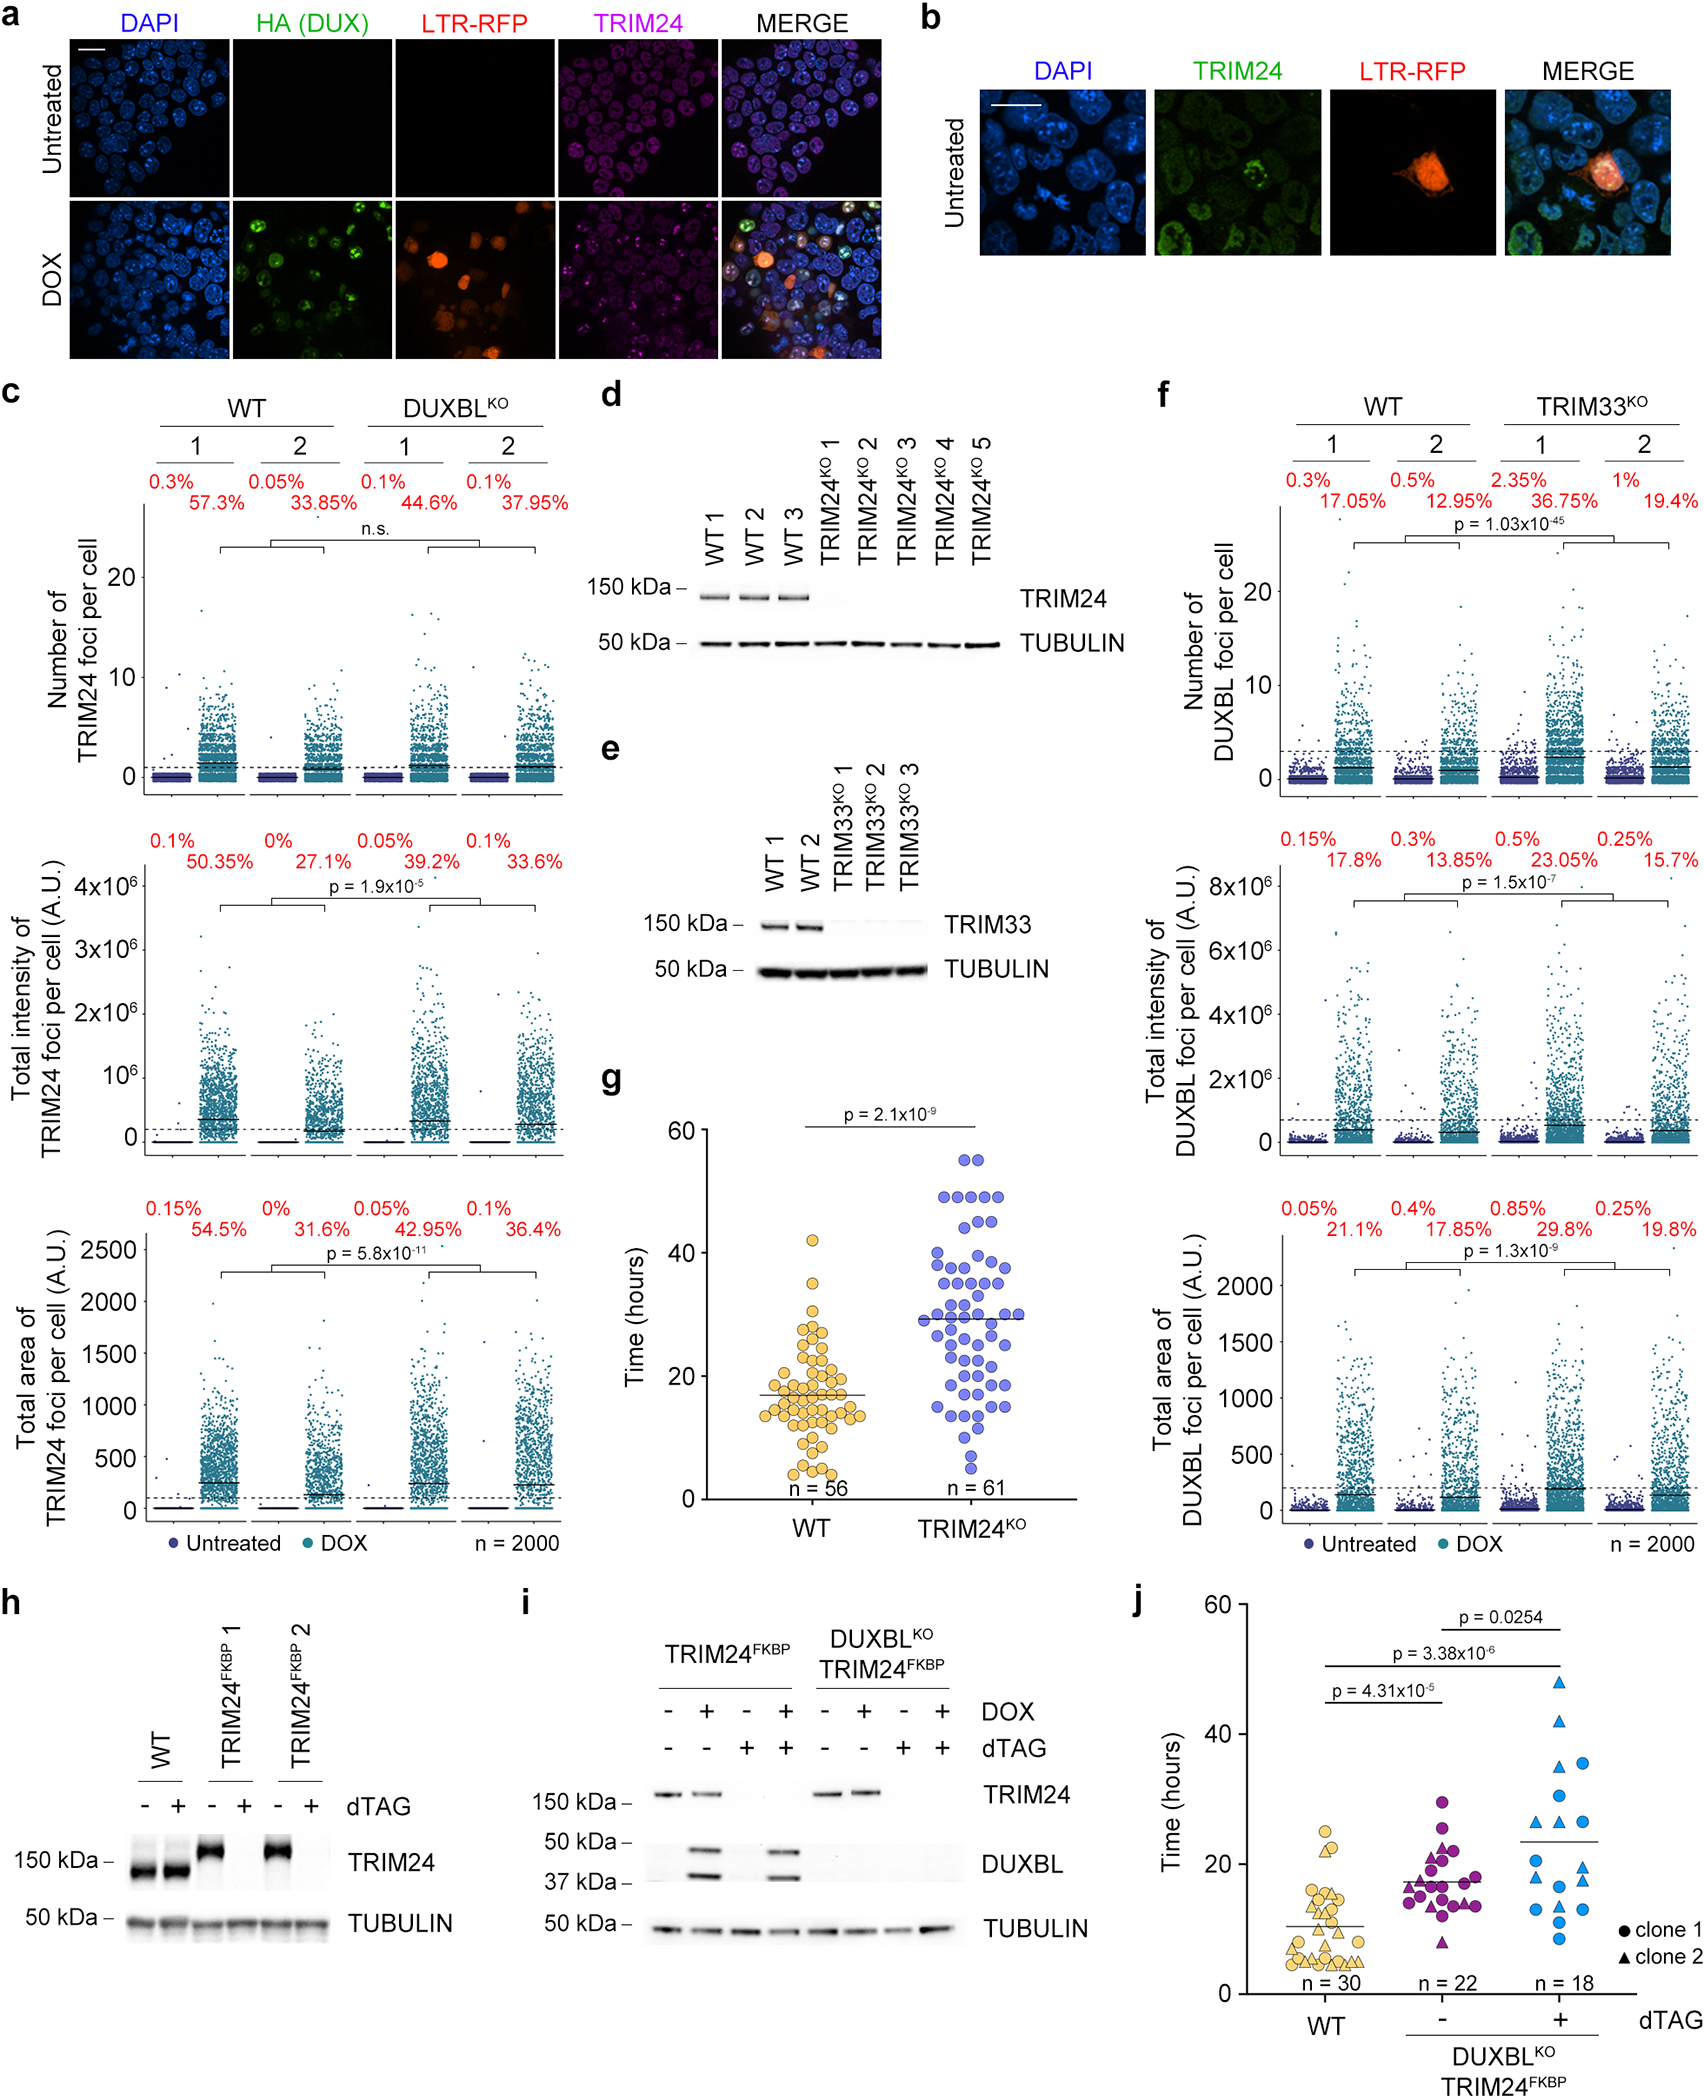
Extended Data Figure 9: DUXBL/TRIM33/TRIM24 colocalize at DUX-induced nuclear foci.

a) Immunofluorescence analysis of DUX (HA) and endogenous TRIM24 in untreated or DOX-treated ESCDUX−2XHA. Scale bars, 20 μm. b) Immunofluorescence analysis of endogenous TRIM24 in endogenous 2CLC observed in LTR-RFP reporter WT ESC. Scale bars, 20 μm. For (a,b), DAPI was used to visualize nuclei and two independent experiments were performed but one representative is shown. c) High-throughput imaging (HTI) quantification of the number, total intensity and area of TRIM24 foci (upper, middle and lower panel, respectively) per cell in untreated or DOX-treated LTR-RFP reporter WT or DUXBLKO ESCDUX. d) Western blot analysis of TRIM24 performed in WT and TRIM24KO ESCDUX. e) Western blot analysis of TRIM33 performed in WT and TRIM33KO ESCDUX lysates. f) HTI quantification of the number, total intensity and area of DUXBL foci (upper, middle and lower panel, respectively) per cell in untreated or DOX-treated LTR-RFP reporter WT or TRIM33KO ESCDUX. For (c and f) Percentages of cells above the threshold (dotted line) are indicated. Center lines indicate mean values. n=2000; p values are shown from one-tailed unpaired t-tests. Two independent experiments using at least two WT, DUXBLKO ESCDUX or TRIM33KO ESCDUX clones were performed but one representative is shown. g) Graph showing 2CLC residency time evaluated by using the LTR-RFP reporter in DOX-treated WT and TRIM24KO ESCDUX. p value is shown from a two-tailed unpaired t-test. Plot was generated by using data from two independent ESC lines per genotype. h) Western blot analysis of TRIM24 performed in WT and TRIM24FKBP ESCDUX. i) Western blot analysis of TRIM24 and DUXBL performed in untreated and DOX/dTAG-treated TRIM24FKBP and DUXBLKO; TRIM24FKBP ESCDUX for 16 hours. For (d,e,h,i), tubulin levels were used as loading control and two independent experiments were performed but one representative is shown. j) Graph showing 2CLC residency time evaluated by using the LTR-RFP reporter in dTAG-treated WT and DUXBLKO; TRIM24FKBP ESCDUX. p values are shown from two-tailed unpaired t-tests. Plot was generated by using data from two independent ESC lines per genotype.
