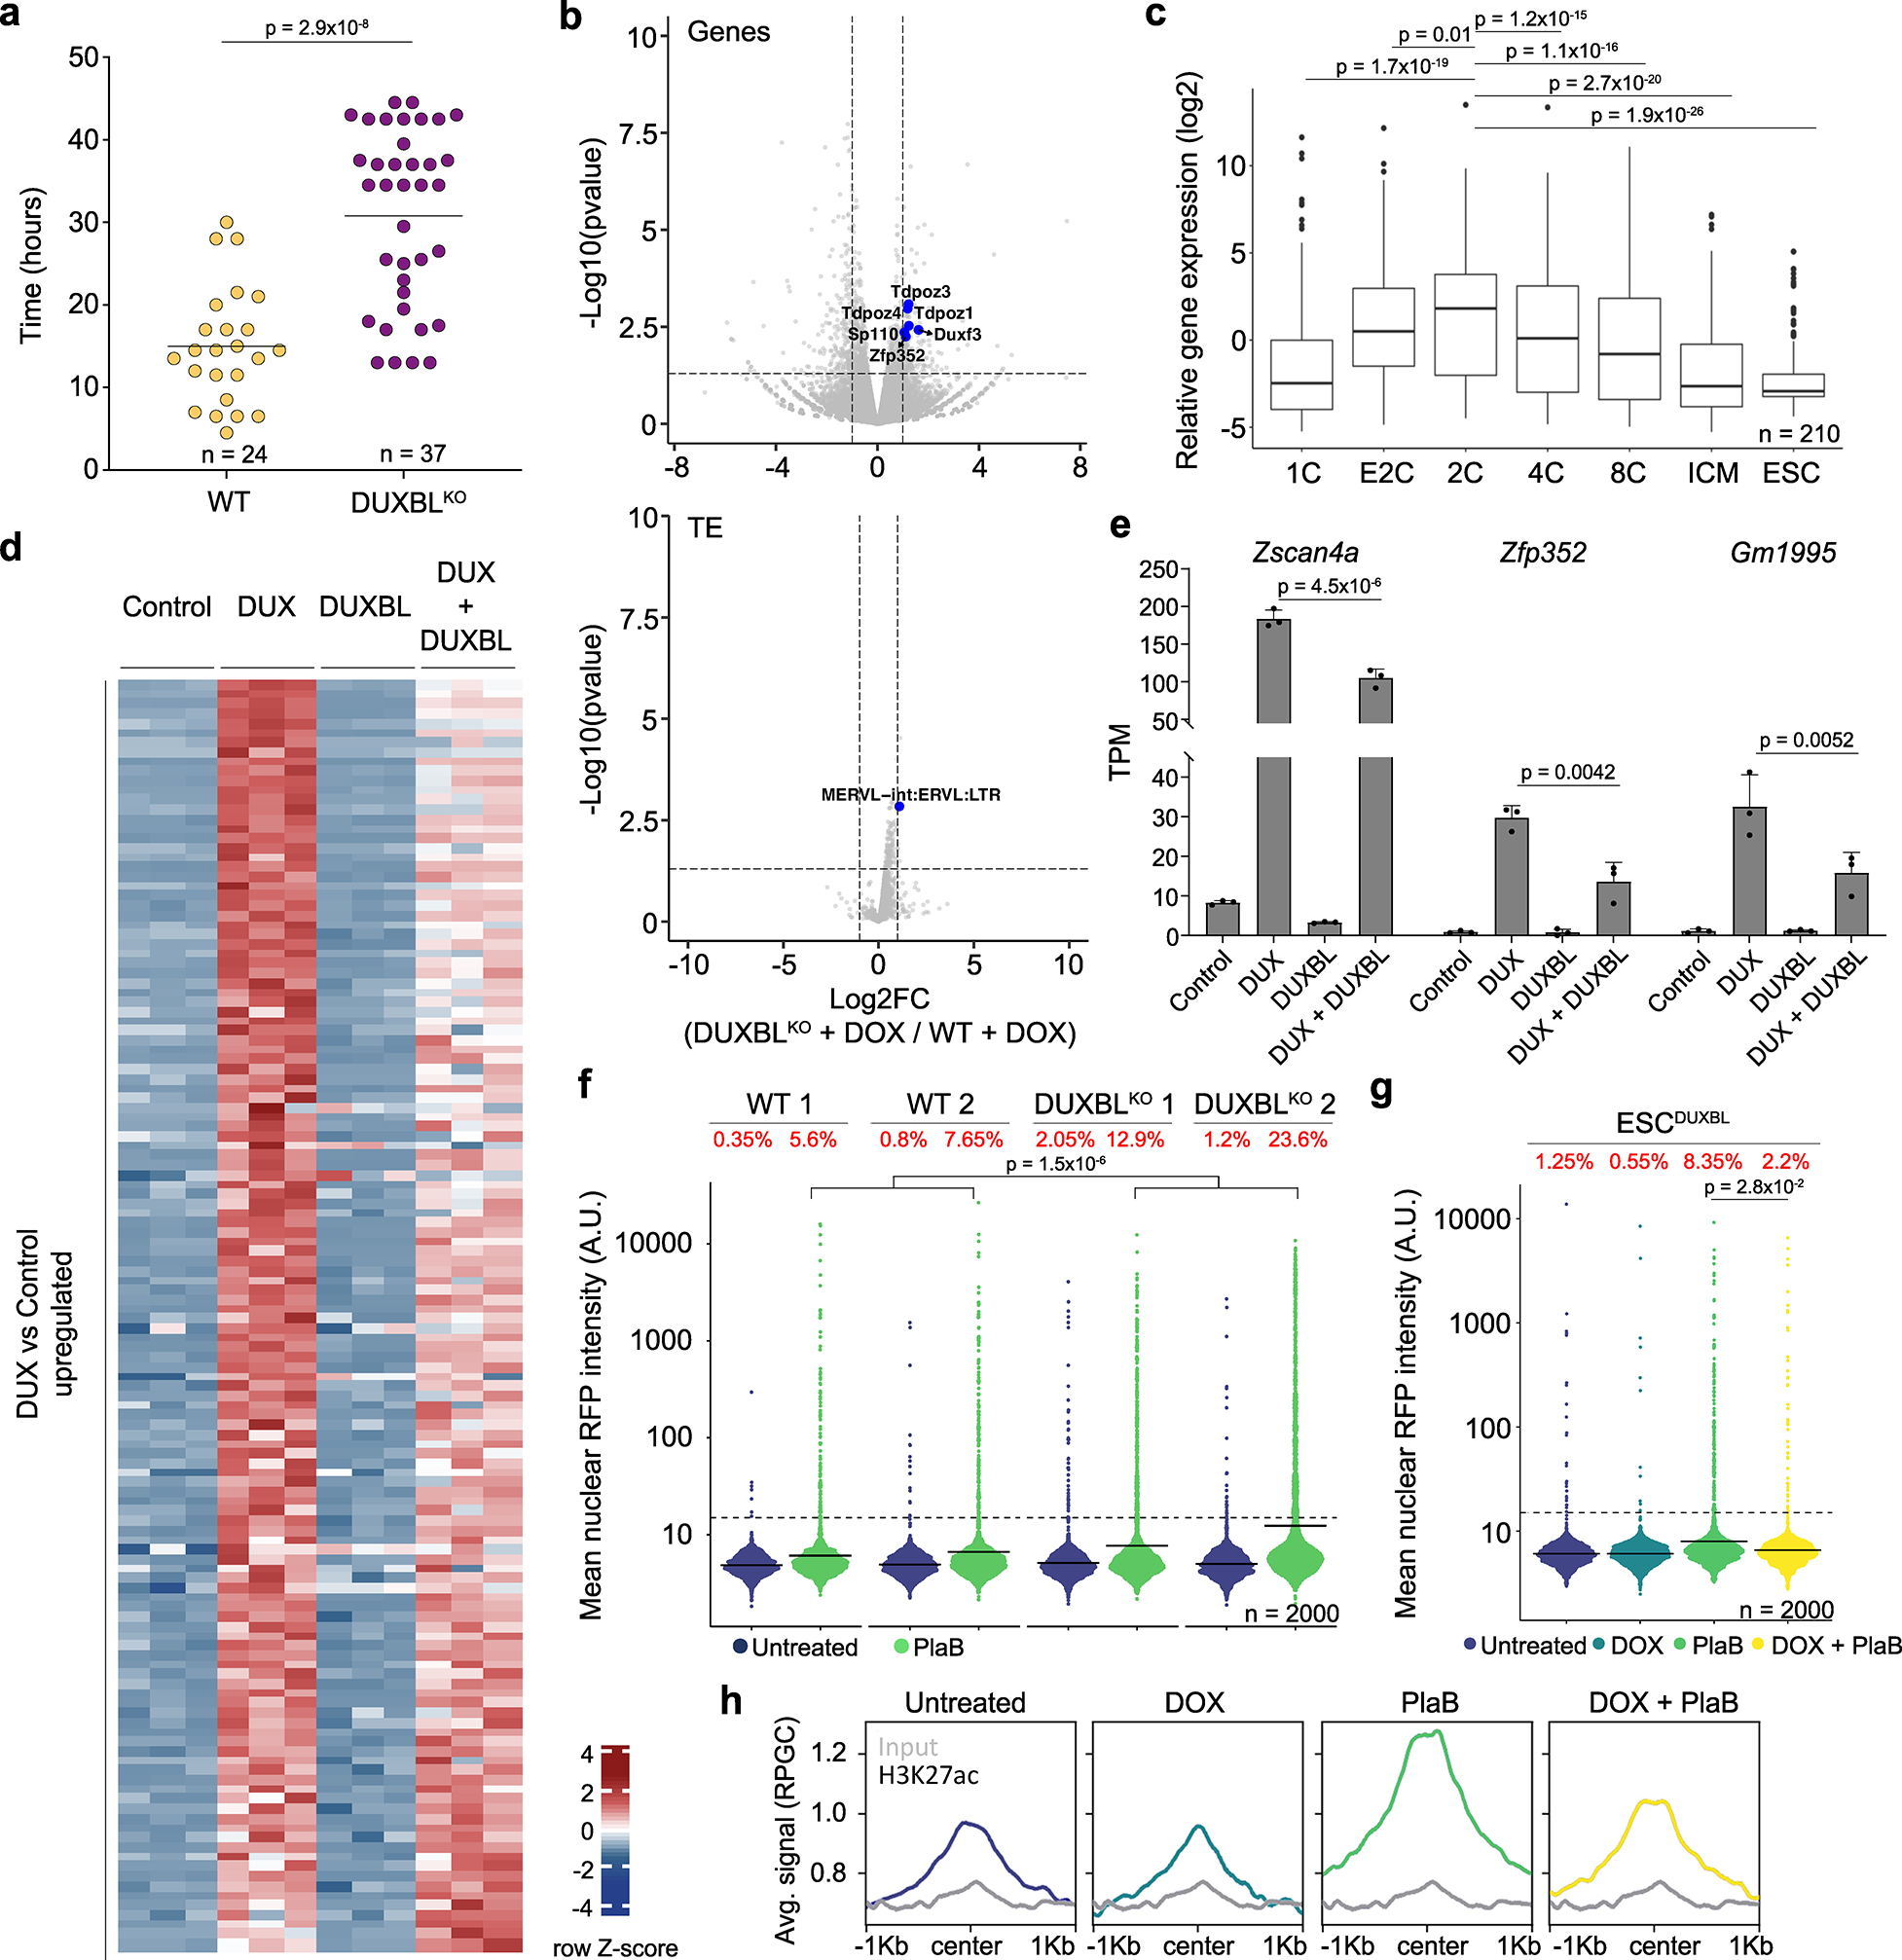
Fig. 2: DUXBL counteracts 2CLC conversion.

a) Graph showing 2CLC residency time evaluated by using the LTR-RFP reporter. p value is shown from a two-tailed unpaired t-test. Two independent experiments were performed but one representative is shown including two ESC lines per condition. b) Volcano plots showing differentially expressed genes (upper panel) and TE (lower panel) between DOX-treated DUXBLKO ESCDUX compared to DOX-treated WT ESCDUX. Relevant genes and TE are highlighted. c) Box and whisker plot showing normalized fold change expression of upregulated genes from (b) during preimplantation development including ESC. RNAseq data obtained from27. p-values are shown from two-tailed unpaired t-tests. Center line indicates the median, box extends from the 25th to 75th percentiles and whiskers extend from the hinge to the largest or smallest value no further than 1.5-fold from the inter-quartile range. Data beyond whiskers are plotted individually. ICM: Inner cell mass. For (b, c), data was generated using two independent ESC lines per genotype and condition. d) Heatmap showing differentially expressed genes between control and DUX and/or DUXBL-expressing ESC. e) Plot showing mean±standard deviation (SD) for transcript per million (TPM) values for Zscan4a, Zfp352 and Gm1995. Data was obtained from (d). p value was obtained from two-tailed Wald test. For (d, e), data was generated using three replicates per condition. f) High-throughput imaging (HTI) quantification of RFP+ cells in LTR-RFP reporter WT and DUXBLKO ESC incubated with 2.5 μM PlaB for 24 hours. g) HTI quantification of RFP+ cells in untreated or DOX-treated LTR-RFP reporter ESCDUXBL incubated with 2.5 μM PlaB for 24 hours. For (f, g), center lines indicate mean values. Percentages of RFP+ cells above the threshold (dotted line) are indicated. n=2000; p value is shown from one-tailed unpaired t-test. Three independent experiments were performed but one representative is shown. h) CUT&RUN read density plot (reads per genome content, RPGC) showing H3K27ac enrichment at DUX-bound sites in untreated or DOX-treated ESCDUXBL incubated with 2.5 μM PlaB for 24 hours. Input (IgG) is shown as control. Data was generated using two independent ESC lines per condition but results from one representative ESC line are shown.
