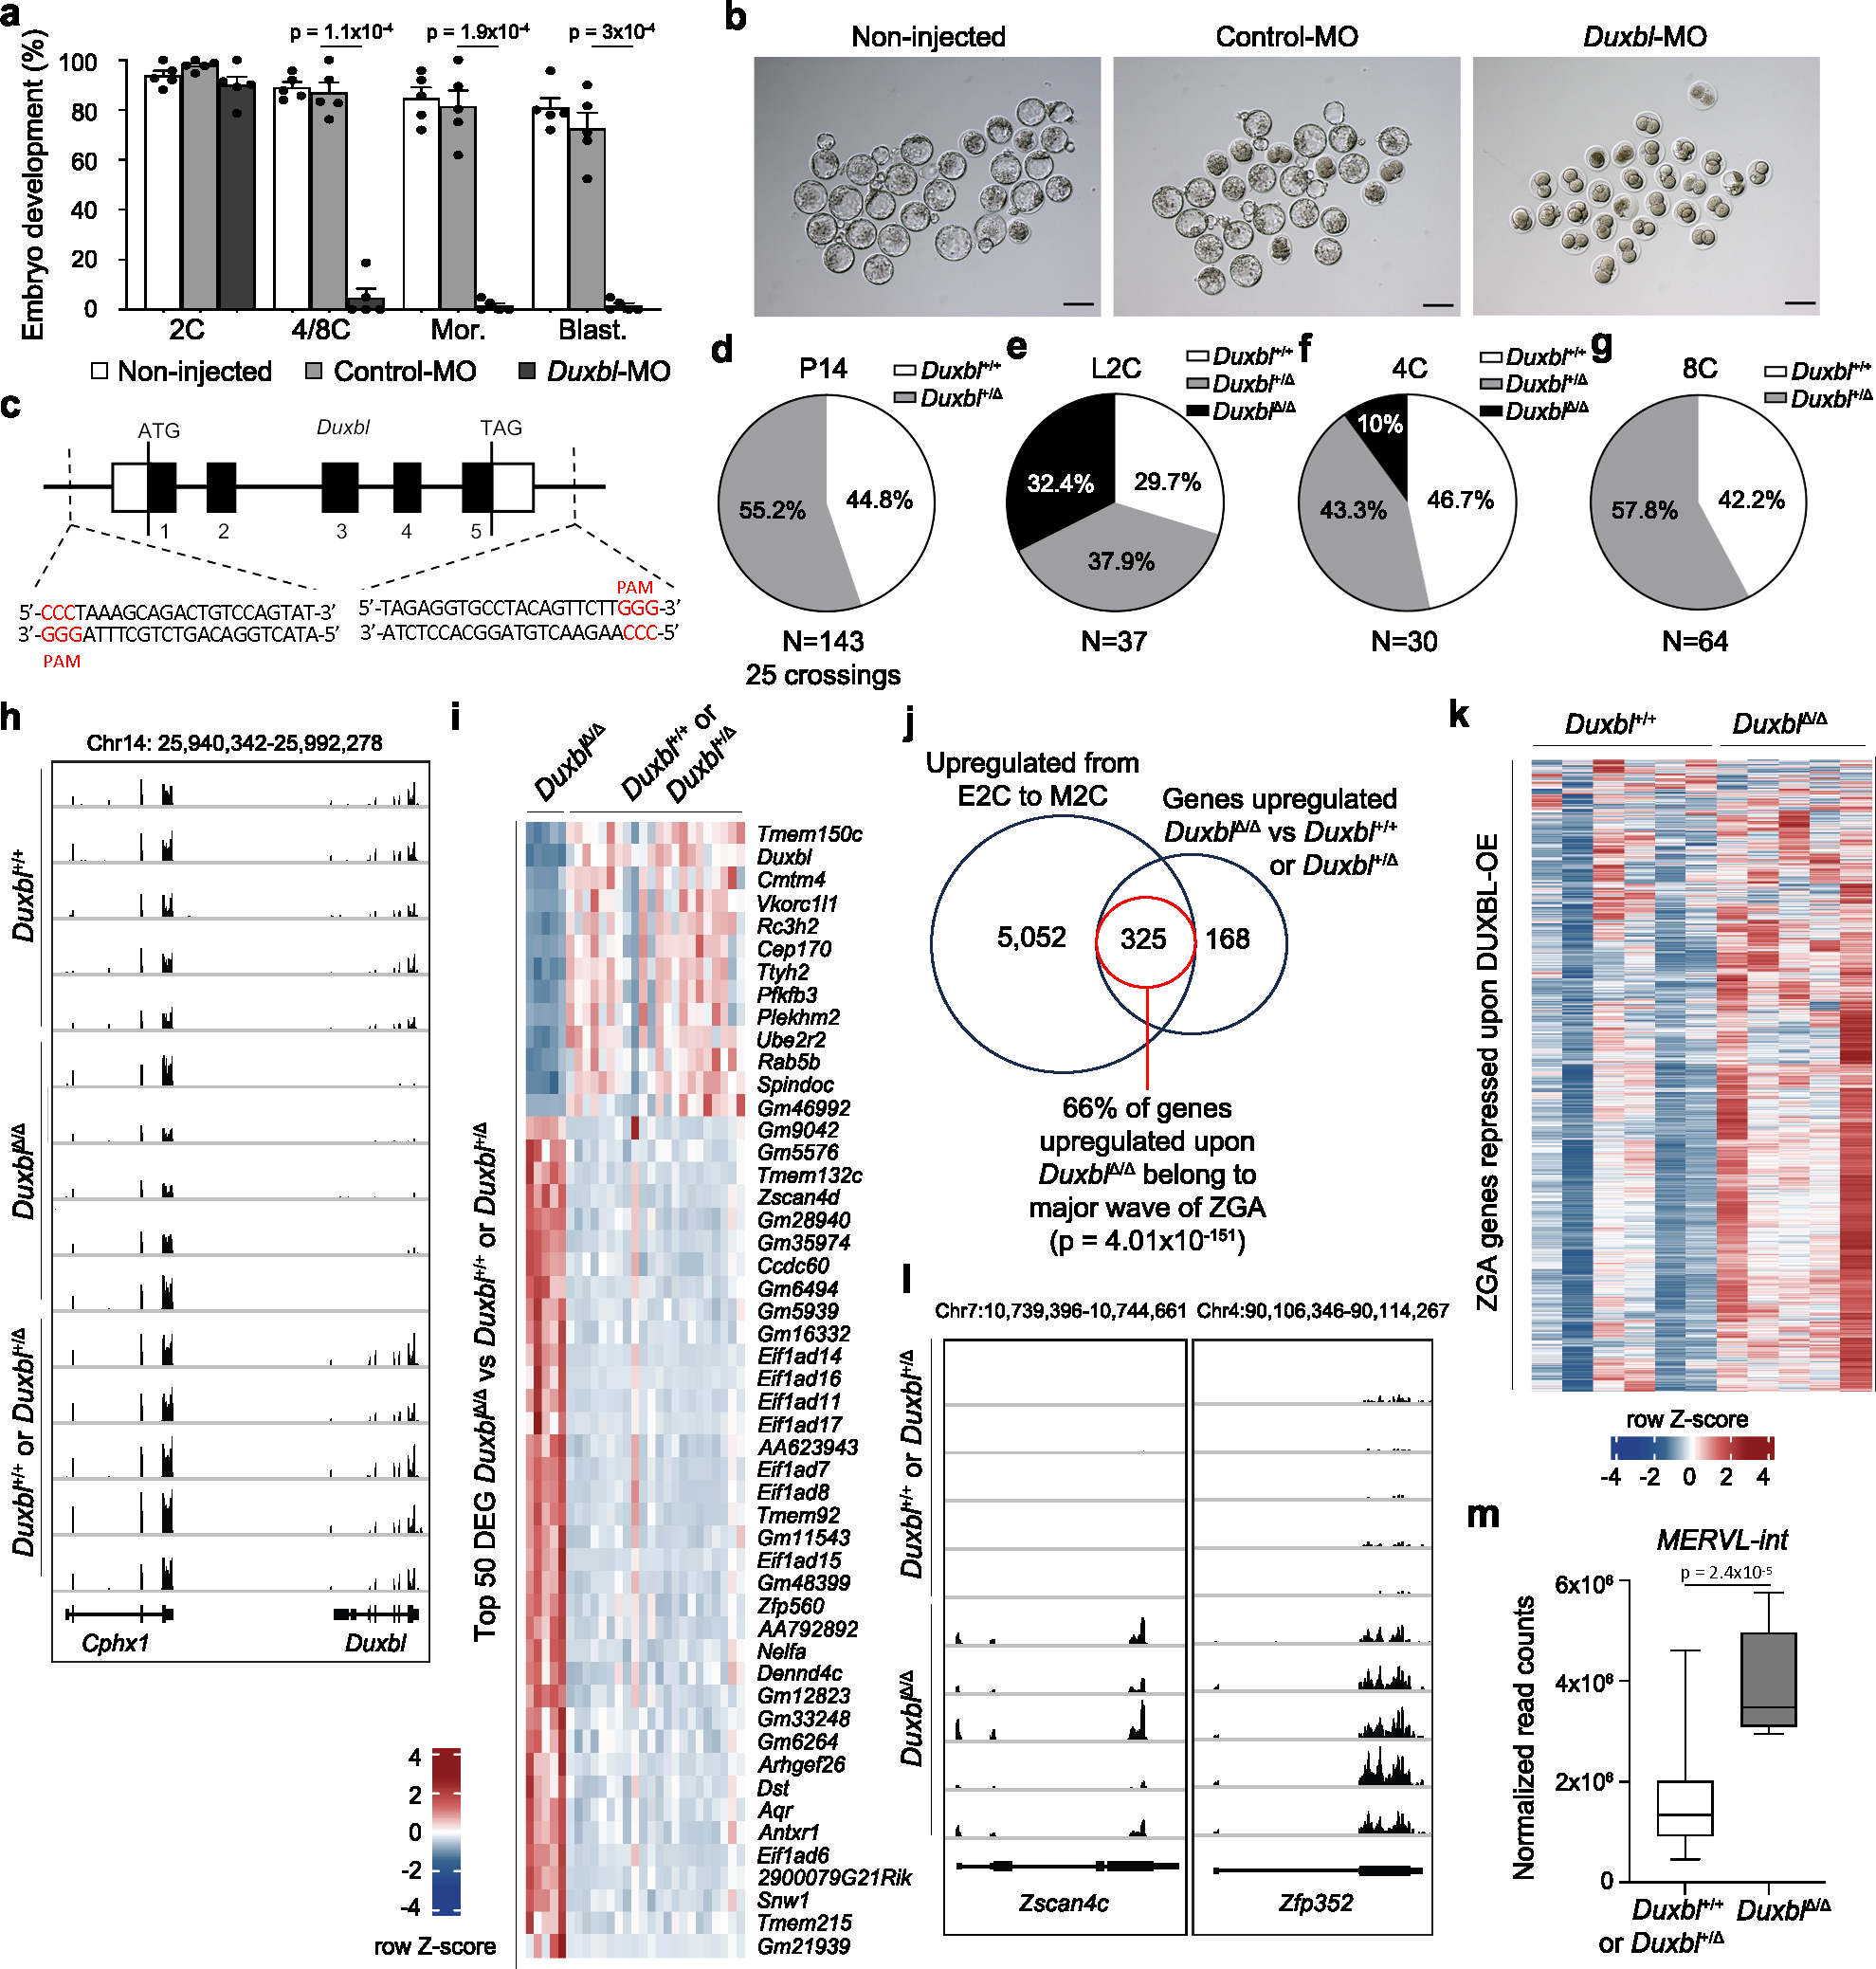
Fig. 4: DUXBL is essential for mouse embryo development.

a) Bar plot showing mean±standard error of the mean (SEM) summarizing five independent experiments with 25–45 microinjected 1C embryos per group [non-microinjected, control morpholino (Control-MO), or Duxbl morpholino (Duxbl-MO)-injected embryos] per experiment. Embryos correspond to late 2C, 4C/8C, Mor (morula) and Blast (blastocyst) (48, 72, 96 and 120 hours post hCG, respectively). p values are from one-tailed unpaired t-tests. b) Brightfield images of the embryos from one representative experiment out of five from (a). Scale bar,100 μm. c) Duxbl locus and sgRNAs used for the CRISPR-based knockout strategy. d-g) Pie charts showing percentages of genotypes from Duxbl+/Δ crossings at P14 (d), late 2C (e), 4C (f) and 8C (g). h) Genome browser tracks from individual embryos showing normalized expression levels of Duxbl and Cphx in WT embryos and embryos obtained from Duxbl+/Δ crossings. i) Heatmap showing the expression level of the top 50 differentially expressed genes according to p-adj when comparing DuxblΔ/Δ and Duxbl+/Δ or Duxbl+/+ embryos. j) Overlap between genes upregulated in DuxblΔ/Δ embryos compared to Duxbl+/Δ or Duxbl+/+ embryos at late 2C and genes upregulated during the transition from early to mid 2C-stage in WT embryos (Supplementary Table 5). Data from26. Hypergeometric test (one-tailed Fisher’s exact) was used to calculate significance of overlap. k) Heatmap comparing the expression of ZGA genes repressed by DUXBL overexpression (overlap set from Fig. 3f) in WT embryos and DuxblΔ/Δ embryos. l) Genome browser tracks from individual embryos obtained from Duxbl+/Δ crossings as in (h) showing normalized expression levels of known DUX targets5. m) Box plots showing normalized read counts of MERVL-int elements in Duxbl+/+ or Duxbl+/Δ and DuxblΔ/Δ embryos. Center line indicates the median, box extends from the 25th to 75th percentiles and whiskers show Min to Max values. p value is shown from one-tailed unpaired t-test. A total of Duxbl+/+ or Duxbl+/Δ (n=22 combined) and DuxblΔ/Δ (n=5) late 2C embryos were used to generate plots from (i, j and m). For (h, k and l) a set of representative Duxbl+/+ or Duxbl+/Δ and all DuxblΔ/Δ late 2C embryos are shown.
