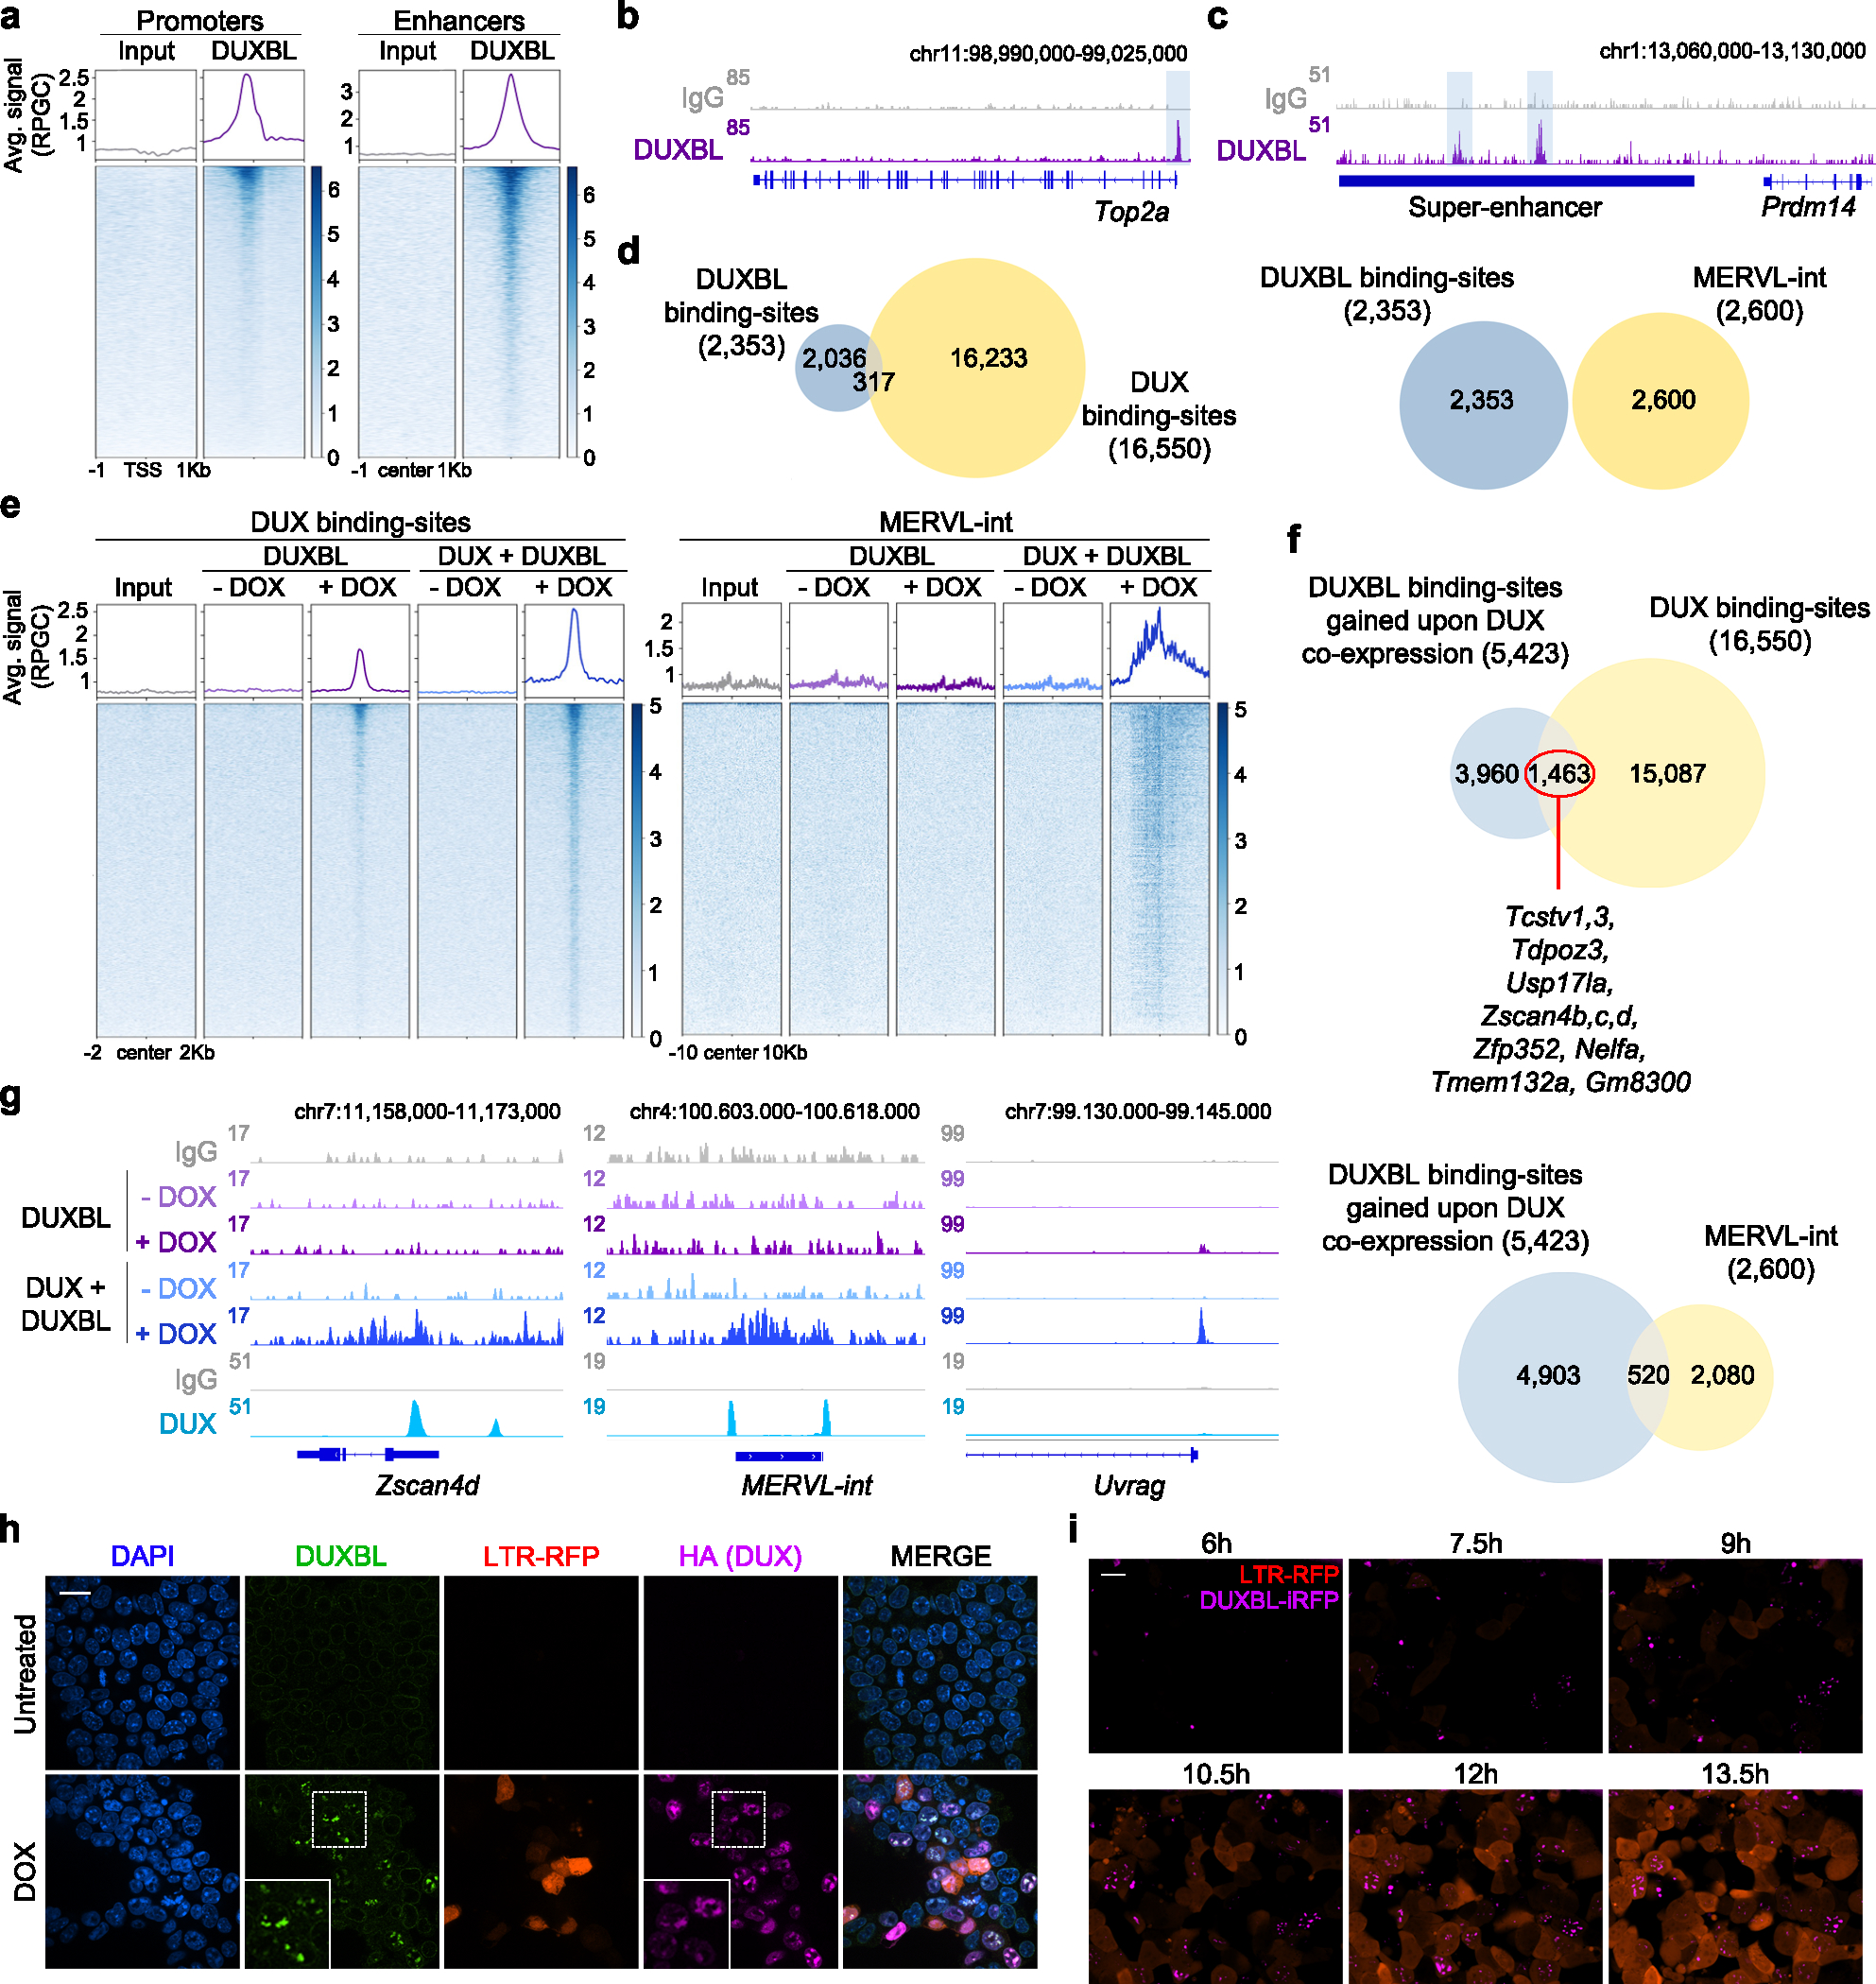
Fig. 5: DUX-mediated chromatin opening facilitates DUXBL binding to DUX-bound regions.

a) CUT&RUN normalized read density plot (reads per genomic content, RPGC) and corresponding heatmaps showing DUXBL enrichment at gene transcriptional start sites (TSS, left panel) and traditional ESC enhancers (right panel) in WT ESC expressing DUXBL. Input (IgG) is shown as control. Two independent ESC lines were used but data from one representative is shown. b, c) Genome browser tracks corresponding to individual samples from (a) showing DUXBL occupancy at a representative example of a gene promoter (b) or a super-enhancer (SE) (c). DUXBL binding site are highlighted. Input (IgG) is shown as control. d) Venn diagrams showing the number of DUXBL peaks overlapping with DUX-binding sites (left) and MERVL-int repeats (right). The set of DUXBL peaks was generated using data from two independent ESC lines. e) CUT&RUN read density plot (RPGC) and corresponding heatmaps showing DUXBL enrichment at the indicated genomic regions in DOX-treated WT ESC expressing DUXBL or DUX/DUXBL as shown. Input (IgG) is shown as control. Two independent experiments were performed but one representative is shown. f, Venn diagrams showing the number of DUXBL binding-sites gained upon DUX co-expression overlapping with DUX-binding sites (upper panel) and MERVL-int elements (lower panel). Representative genes in proximity to DUX-bound sites enriched for DUXBL binding are shown. g) Genome browser tracks corresponding to individual samples from (e) showing DUX (data from5) and DUXBL enrichment (our data) at the indicated genomic region with a representative example of DUXBL binding to DUX-bound regions, Zscan4d and a MERVL-int repeat, and to a DUX unbound gene, Uvrag. Input (IgG) is shown as control. h) Immunofluorescence analysis of DUX (HA) and endogenous DUXBL in LTR-RFP reporter DOX-treated ESCDUX. DAPI was used to visualize nuclei. Scale bar, 20 μm. Dashed regions are zoomed-in in the insets. i) Time lapse microscopy experiment performed in LTR-RFP reporter DOX-induced ESCDUX endogenously tagged with miRFP702 at the Duxbl locus. Time since the addition of DOX is indicated. Scale bar, 20 μm. For (h, i), two independent experiments using at least two ESC lines were performed but one representative is shown.
