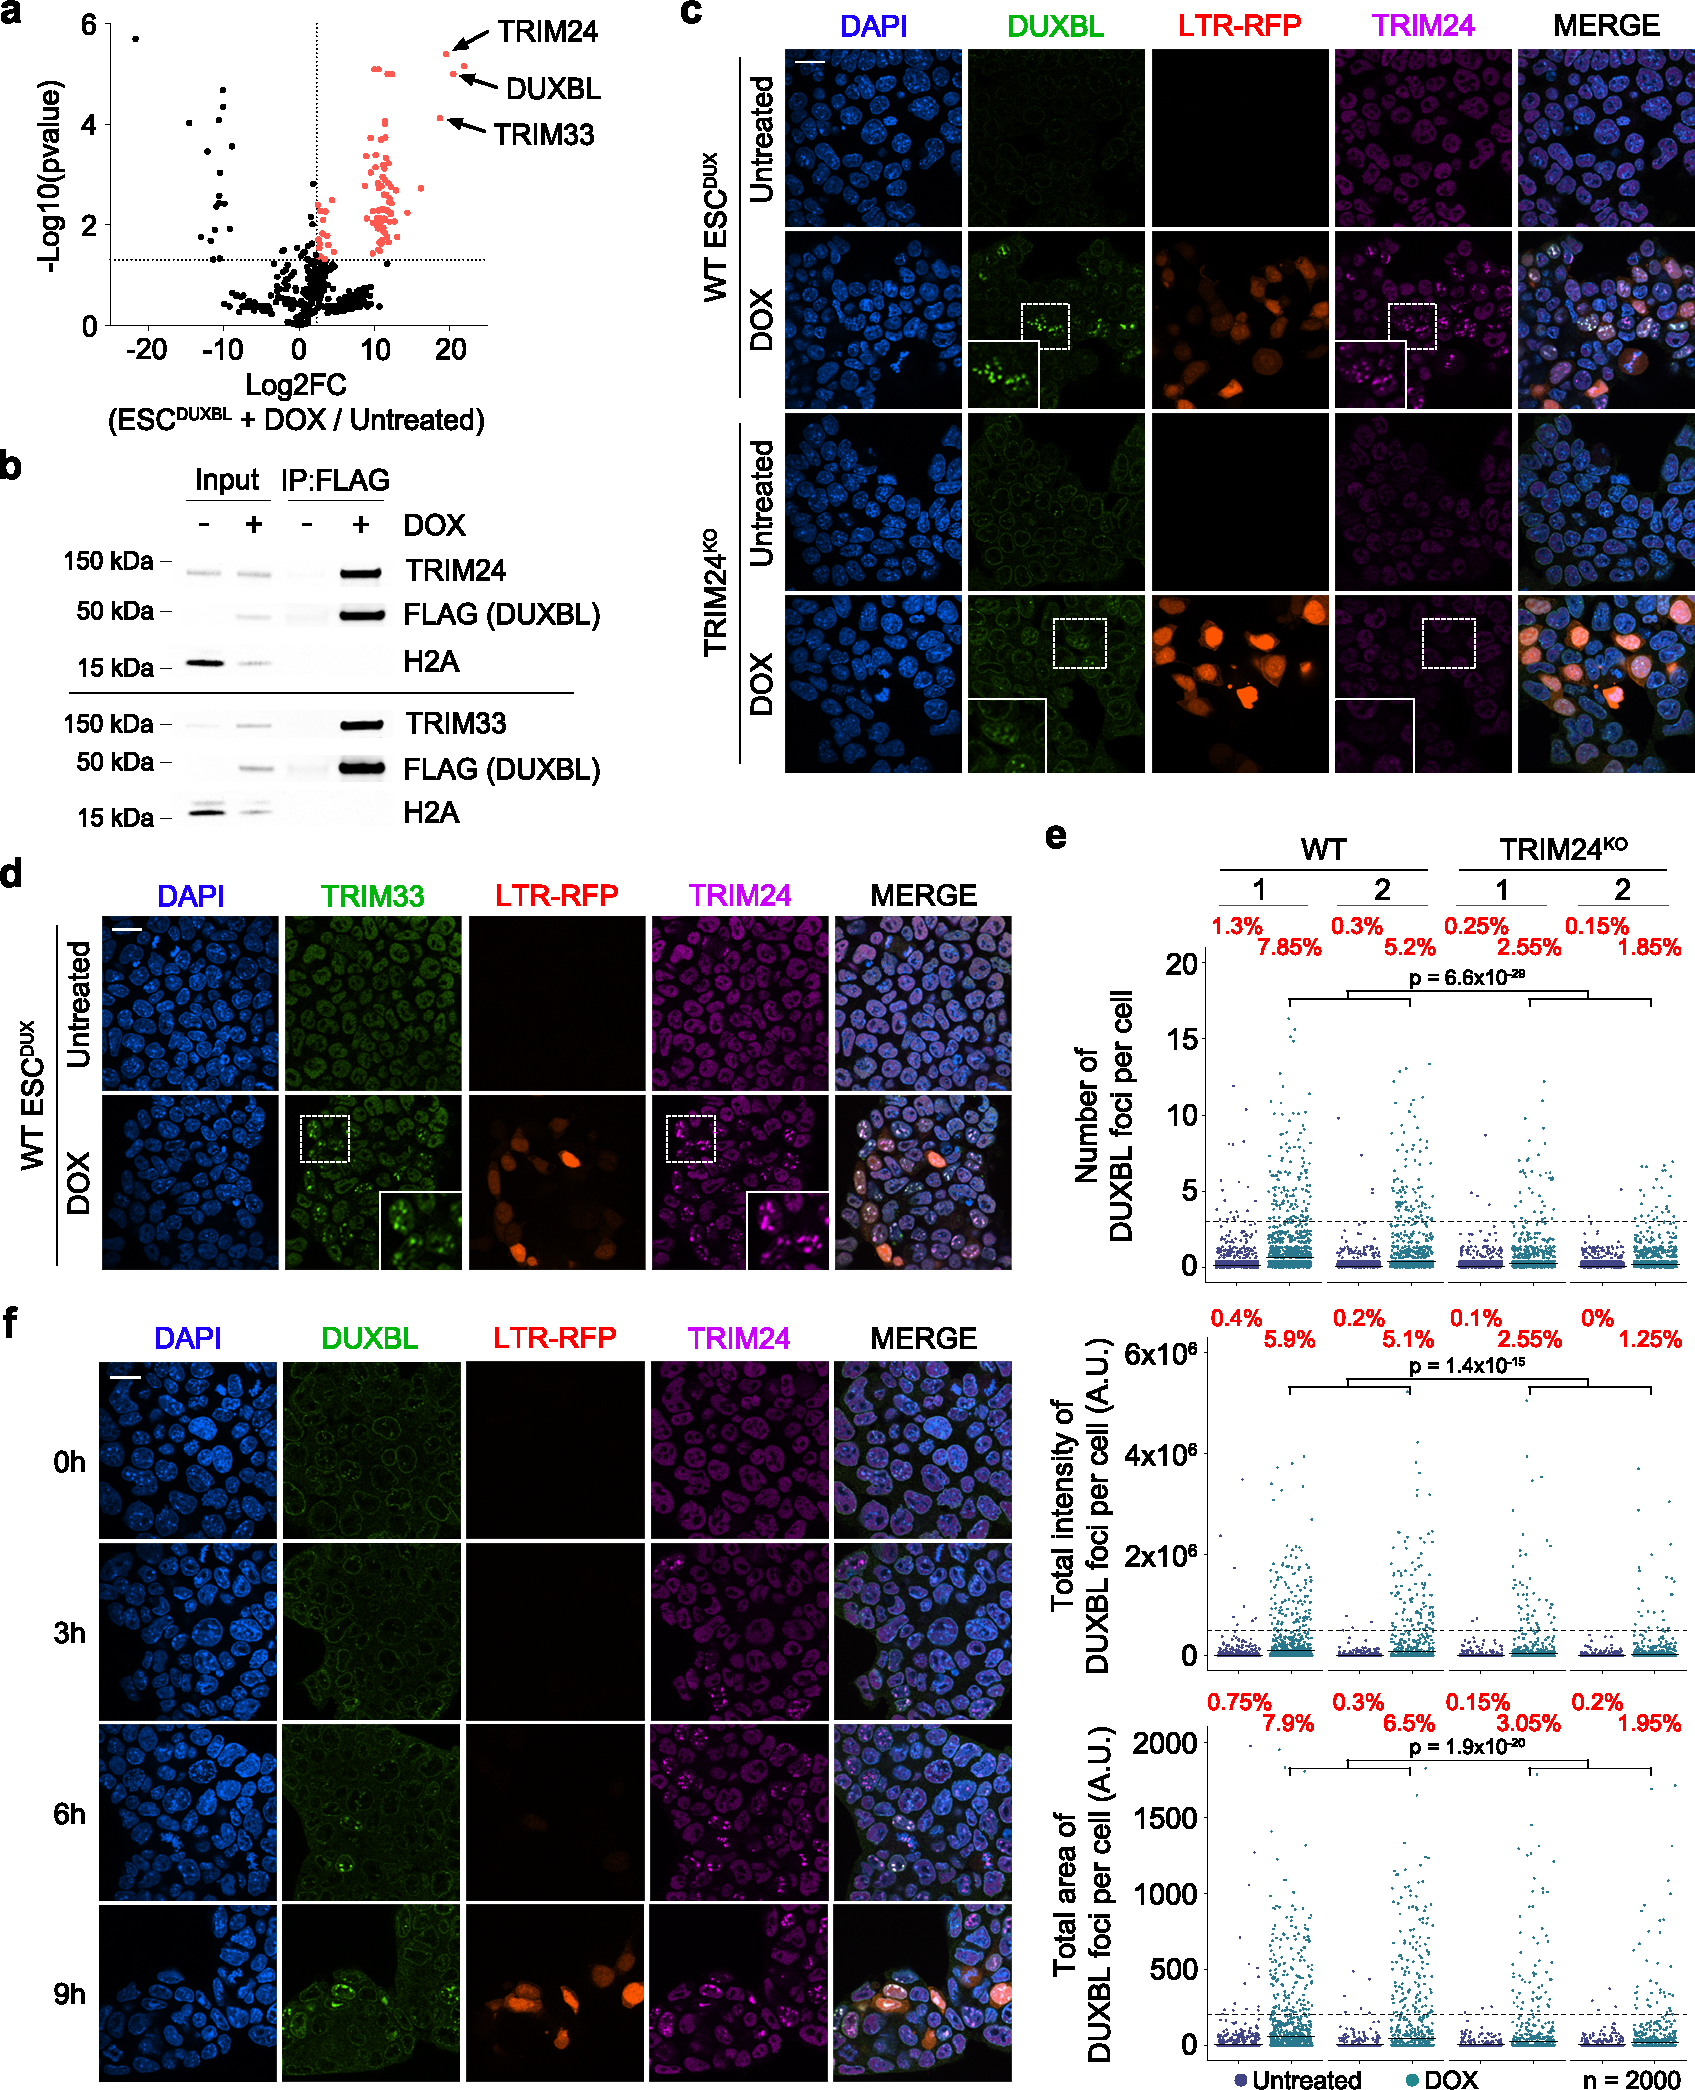
Fig. 6: DUXBL interacts with the TRIM33/TRIM24 complex.

a) Volcano plot showing the enrichment of proteins immunoprecipitated from DOX-treated over untreated ESCDUXBL by using two independent ESC lines from a DUXBL IP-MS experiment. Enriched proteins in DOX-treated cells are highlighted in red. b) Western blot analysis of the indicated proteins performed with FLAG immunoprecipitates obtained from untreated or DOX-treated ESCDUXBL. Two independent experiments were performed but only one representative is shown. c) Immunofluorescence analysis of endogenous DUXBL and TRIM24 in untreated or DOX-treated LTR-RFP reporter WT or TRIM24KO ESCDUX. DAPI was used to visualize nuclei. Scale bars, 20 μm. Dashed regions are magnified in the insets. d) Immunofluorescence analysis of endogenous TRIM33 and TRIM24 in untreated or DOX-treated LTR-RFP reporter ESCDUX. DAPI was used to visualize nuclei. Scale bars, 20 μm. Dashed regions are magnified in the insets. e) High-throughput imaging quantification of the number of DUXBL foci per cell (upper panel), the total intensity of DUXBL foci per cell (middle panel) and the total area of DUXBL foci per cell (lower panel) in untreated or DOX-treated LTR-RFP reporter WT or TRIM24KO ESCDUX. Center lines indicate mean values. n=2000; Percentages above the threshold (dotted line) are indicated. Relevant p values are shown from one-tailed unpaired t-tests. f) Immunofluorescence analysis of endogenous DUXBL and TRIM24 at different timepoints in untreated or DOX-treated WT ESCDUX. Time since the addition of DOX is indicated. DAPI was used to visualize nuclei. Scale bar, 20 μm. Three independent experiments using at least two WT and TRIM24KO ESCDUX clones (c, e) or two ESCDUX clones (d, f) were performed but one representative experiment is shown.
