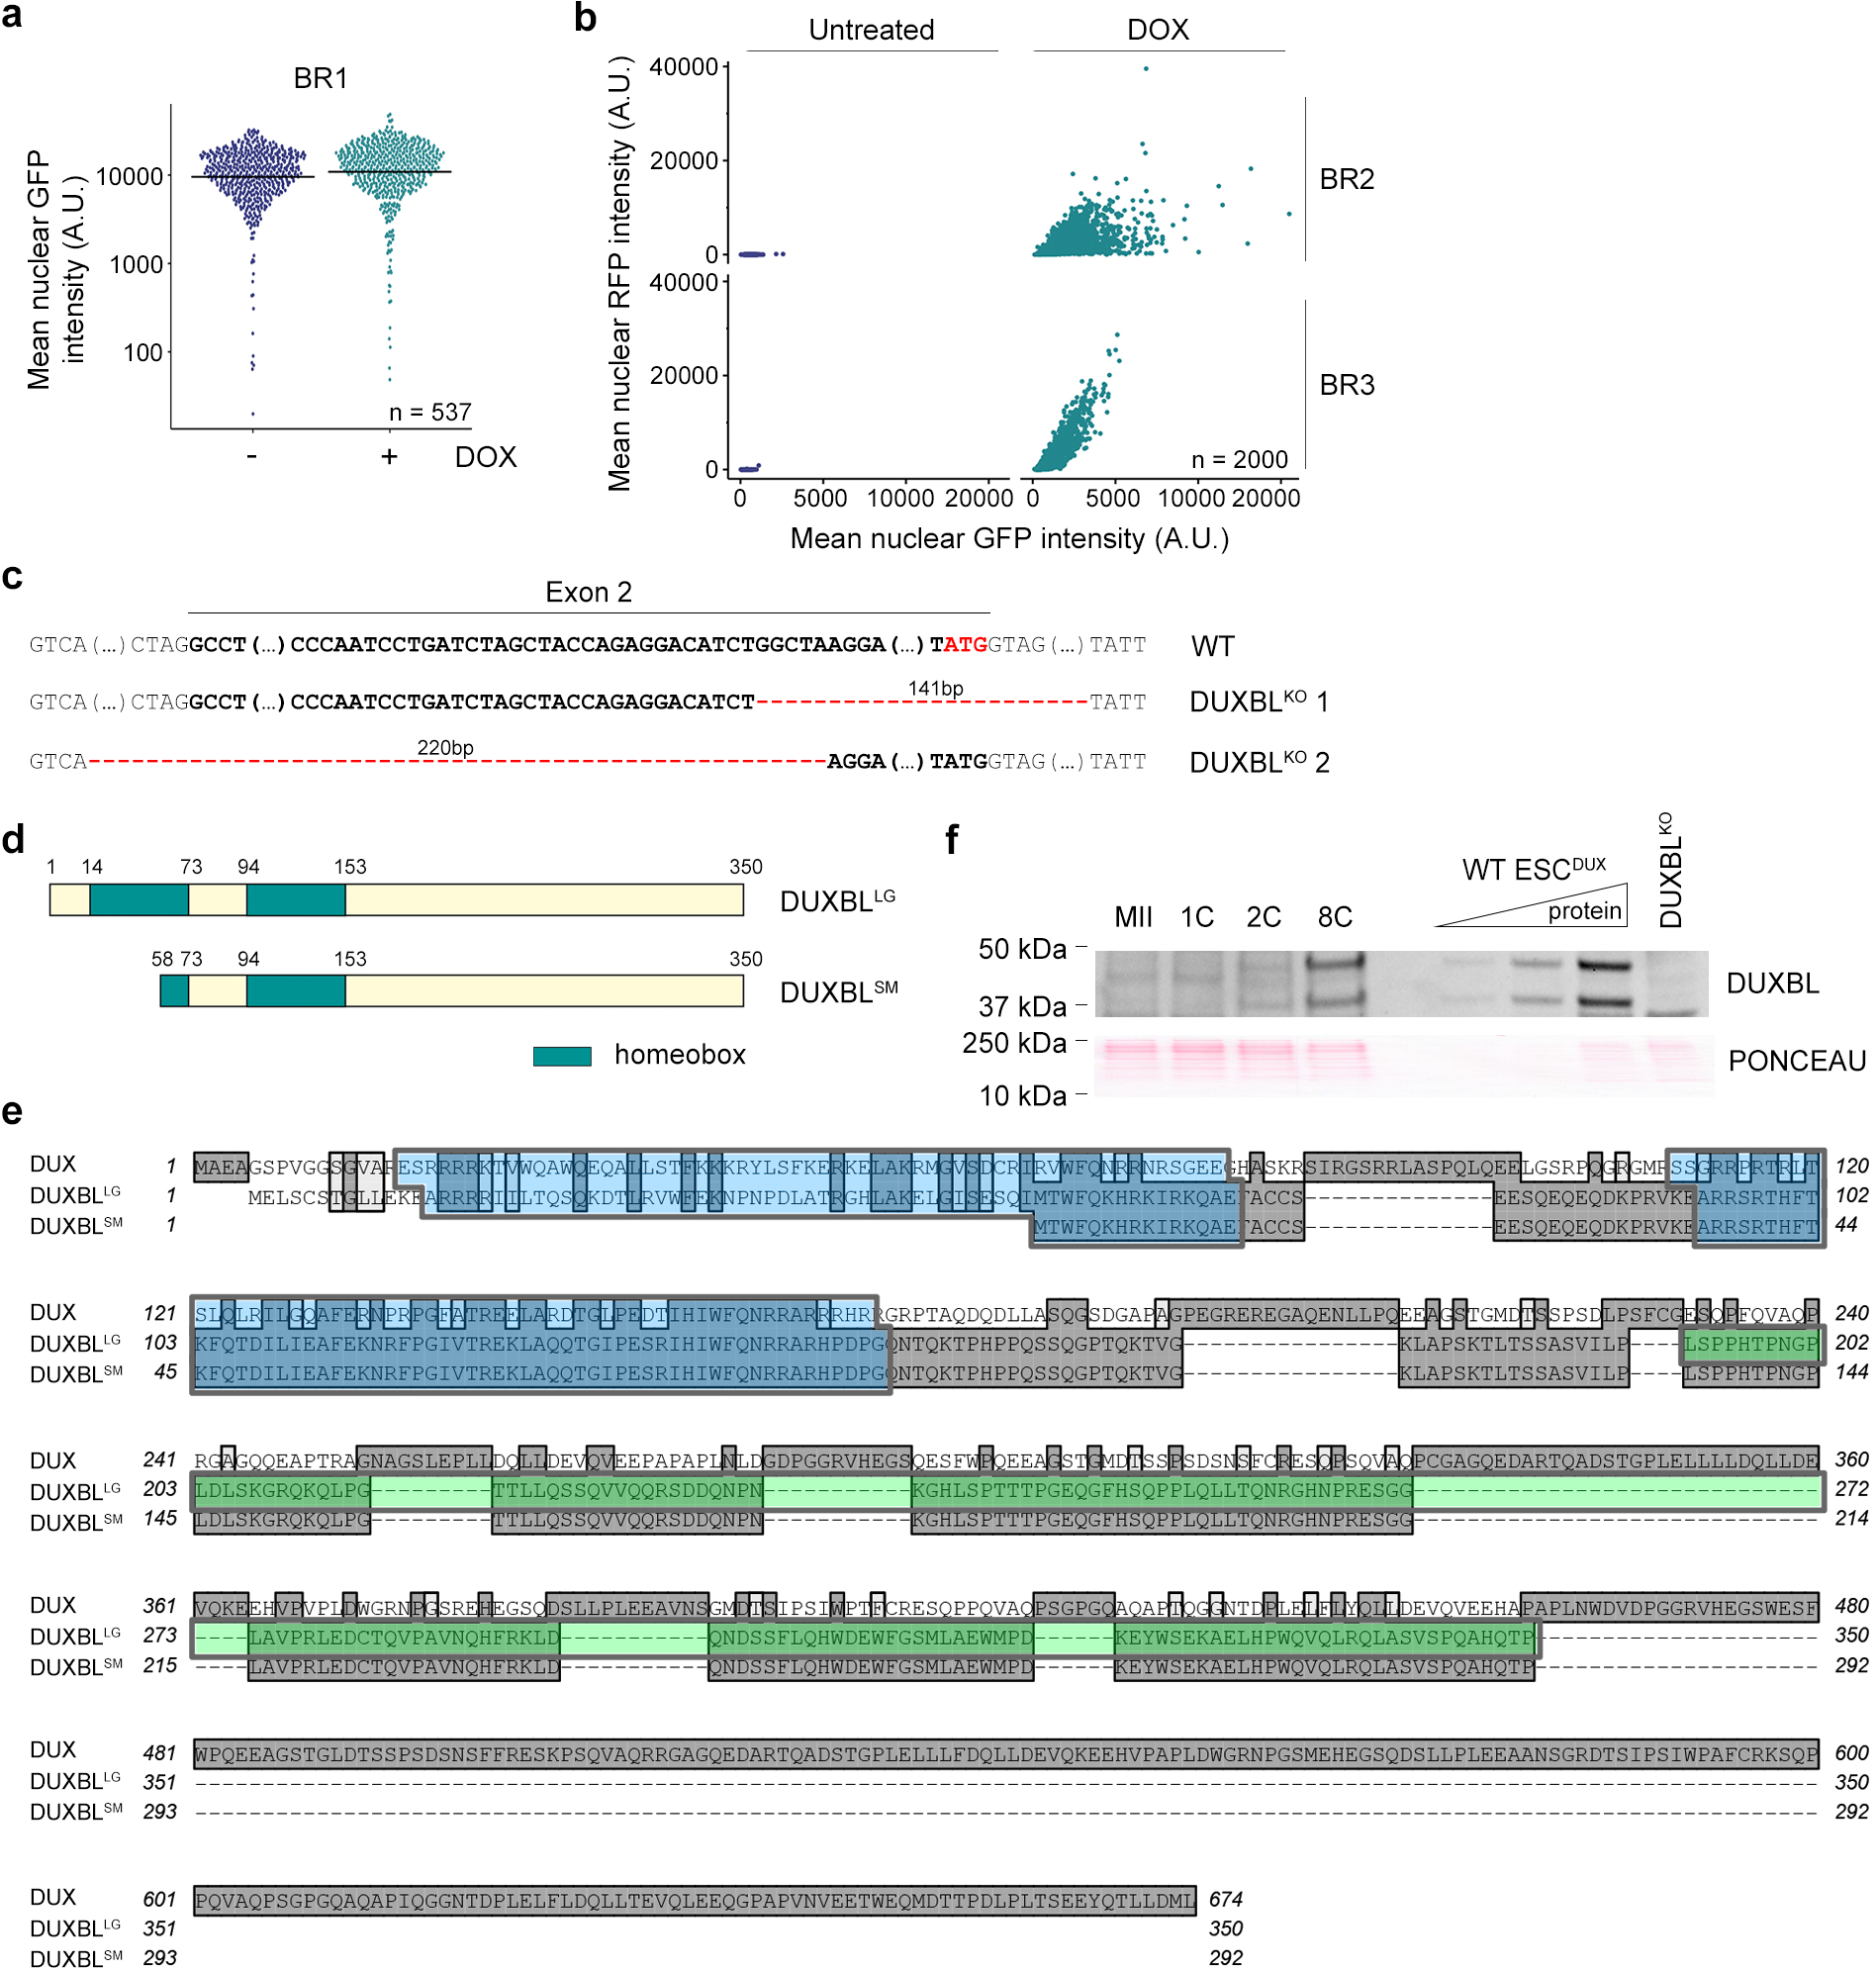
Extended Data Figure 1: DUX induces two protein products from the Duxbl gene.

a) High-throughput imaging quantification of GFP mean nuclear intensity in untreated or DOX-treated for 16 hours BR1-GFP reporter ESCDUX. Center lines indicate mean values. n=537. b) Graph plots showing quantified mean intensity levels of RFP and GFP obtained from untreated and DOX-treated LTR-RFP reporter BR2- or BR3-GFP ESCDUX. c) DNA sequences surrounding exon 2 of Duxbl showing the deletions detected in representative DUXBLKO ESCDUX clones analyzed. DNA sequence from exon 2 is highlighted in bold. The alternative ATG at the end of the second Duxbl exon is highlighted in red. d) Schematic representation of the DUXBL protein products. e) Protein sequence alignment of DUX, DUXBLLG (large DUXBL isoform) and DUXBLSM (small DUXBL isoform). Highlighted in blue are the two homeodomains (note than DUXBLSM lacks most of the first homeodomain). Highlighted in dark grey are conserved residues and in light grey are similar residues. Highlighted in green is the peptide sequence used to generate our custom DUXBL antibody. f) Western blot analysis of DUXBL performed in lysates from a pool of approximately 488 embryos at the indicated stages of development. Increasing amounts of DOX-treated WT ESCDUX as well as DOX-treated DUXBLKO ESCDUX lysates were included as controls. Ponceau staining is shown as a loading control. For (a, b and f), two independent experiments were performed but one representative experiment is shown.
