
FIG. 2:
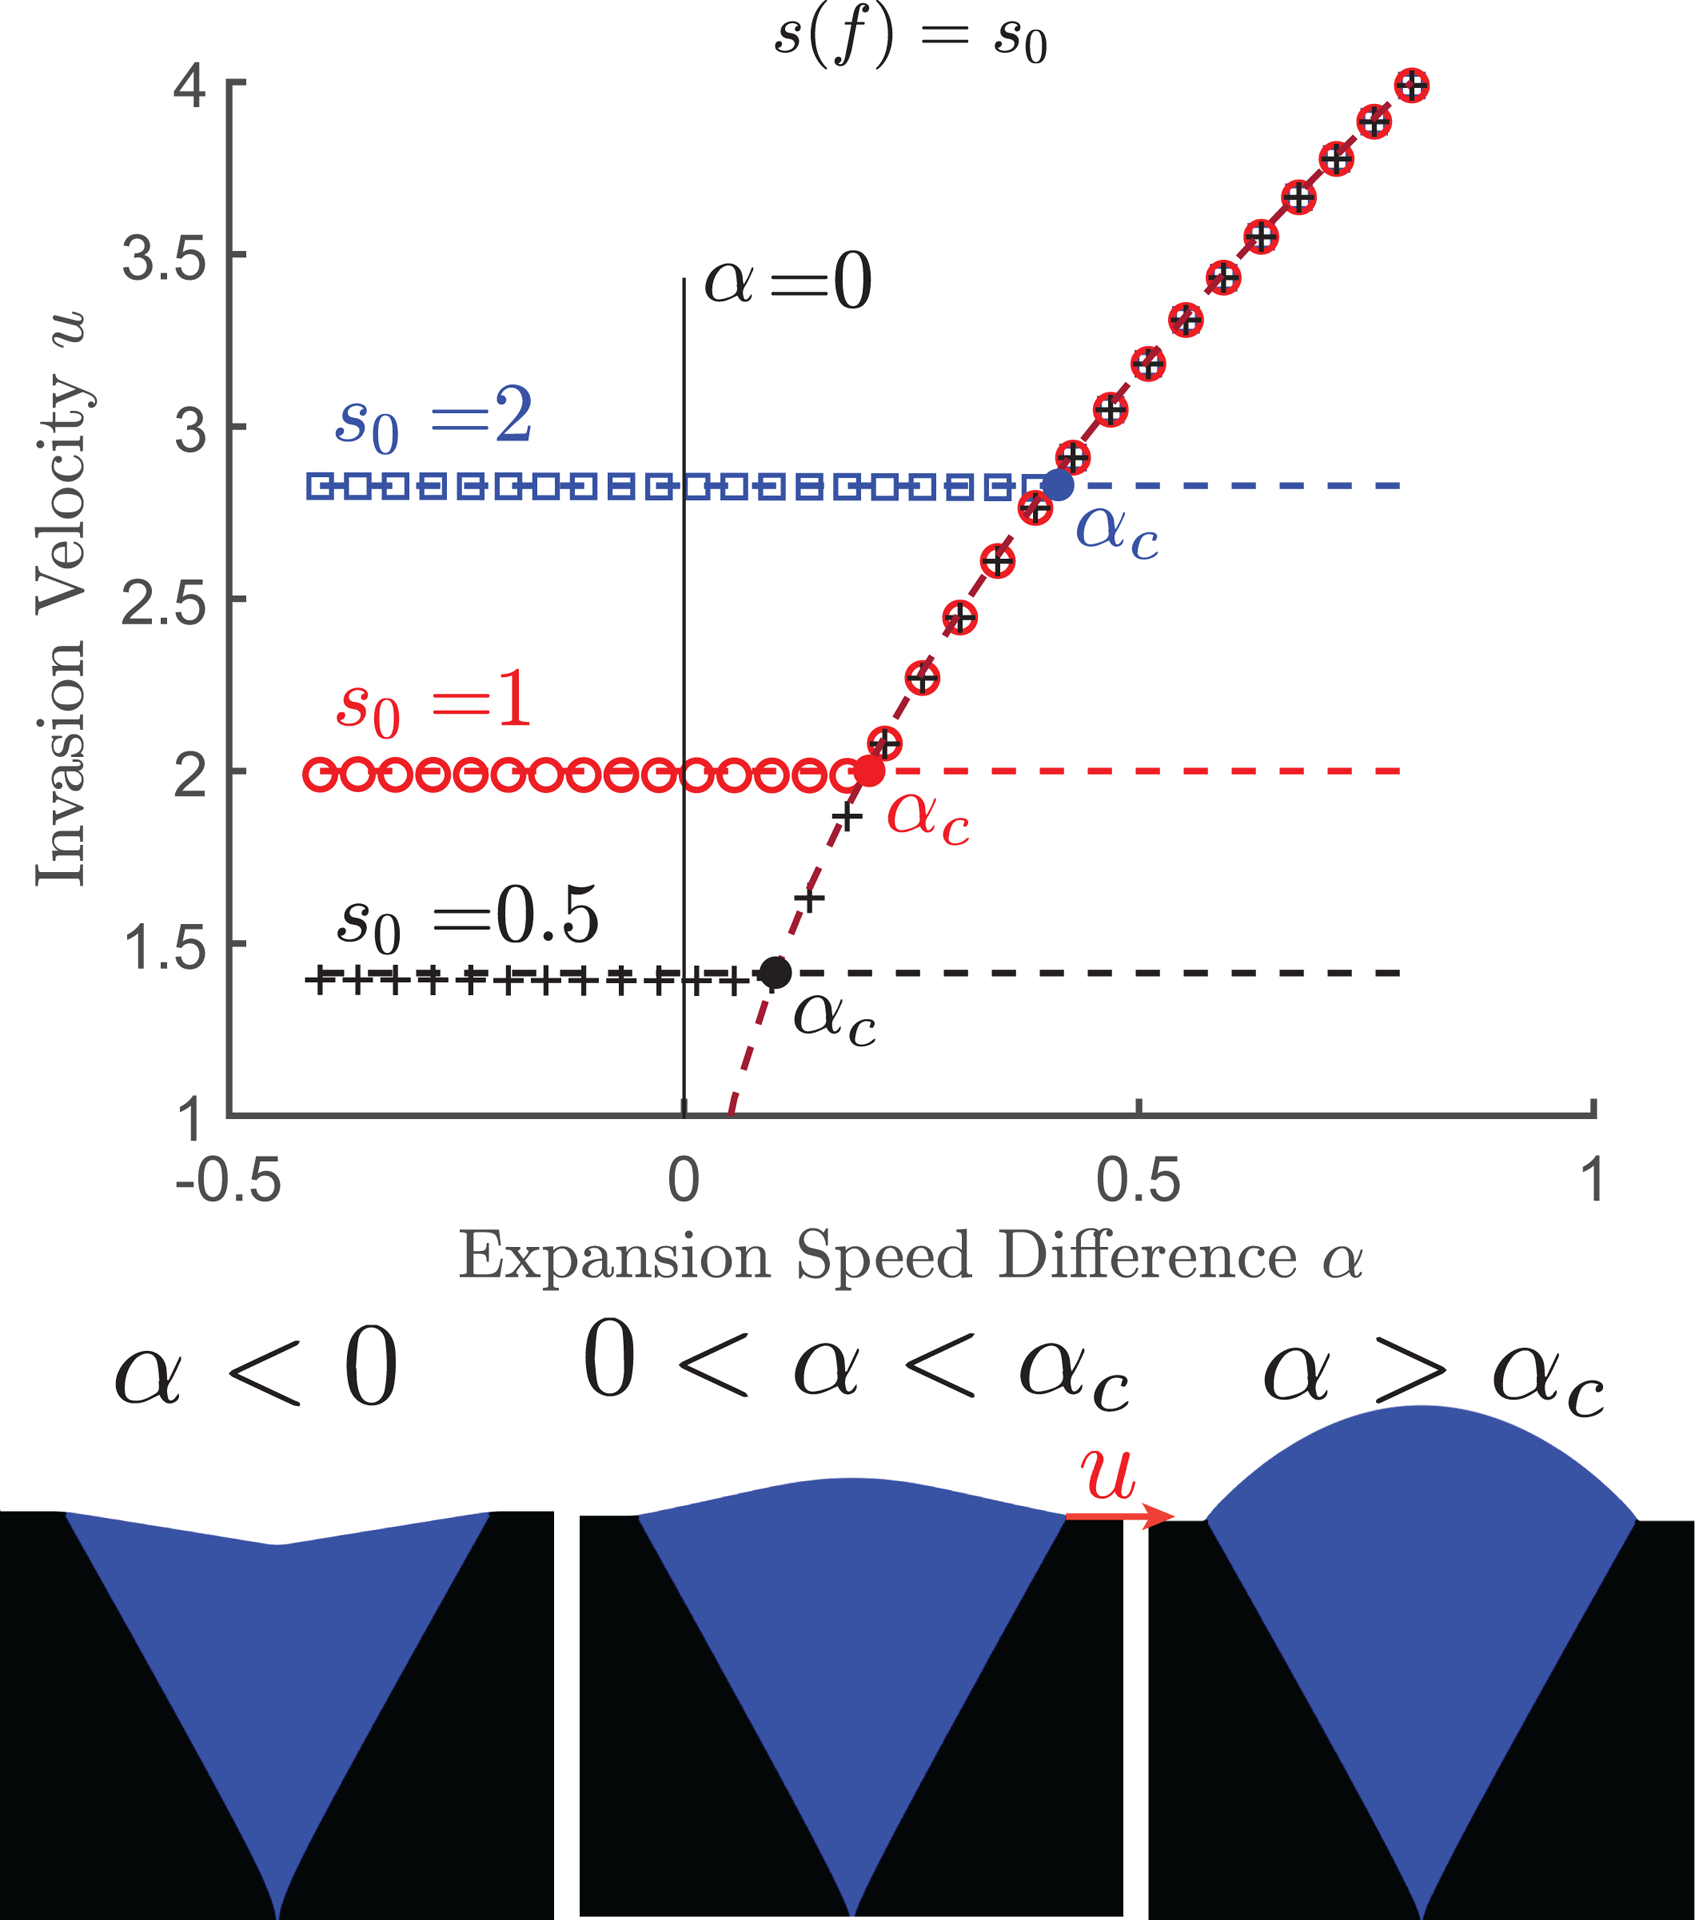
Invasion dynamics in pulled waves. (Top): Invasion velocity shows two regimes with dependence on either or . The horizontal dashed lines are the predicted ‘Fisher velocities’. The curved dashed line is , as predicted by Eq. (3). For each value of the filled in circle shows the location of the transition point between the composite and circular arc morphologies. (Bottom): Depending on , there are three distinct colony morphologies. When the front shape is a V-shaped dent. When the morphology is a composite bulge consisting of a central circular arc transitioning to a constant slope at the bulge edges. When the front is entirely a circular arc. The red arrow shows the invasion velocity , which is the speed of the mutant-wildtype boundary along the horizontal axis. Parameters used are .