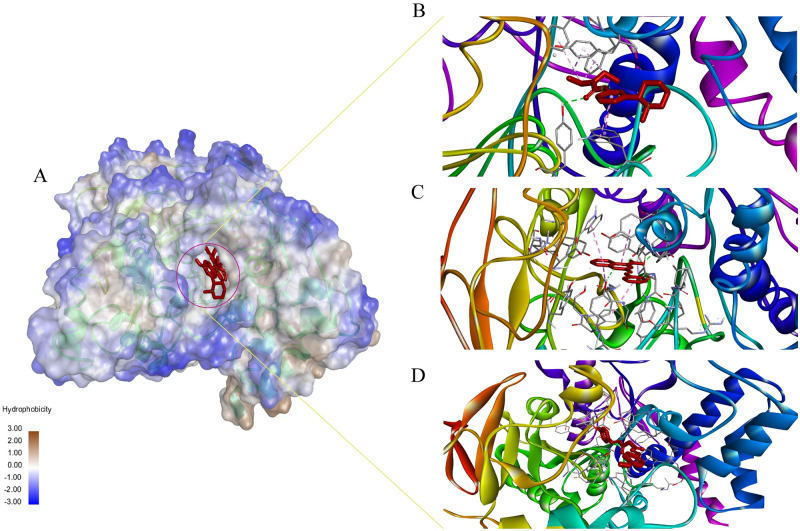
Fig 3. A visual representation of the binding pocket and ligand interaction.
(A) The 3D Structure of protein-ligand complex and protein hydrophobicity mapping. Close view of Complex_1 (B), Complex_3 (C), Complex_6 (D). The protein pocket region is slightly bluish which indicates partially hydrophilic. All the ligands bind to the same side of the protein.

