
Figure 4.
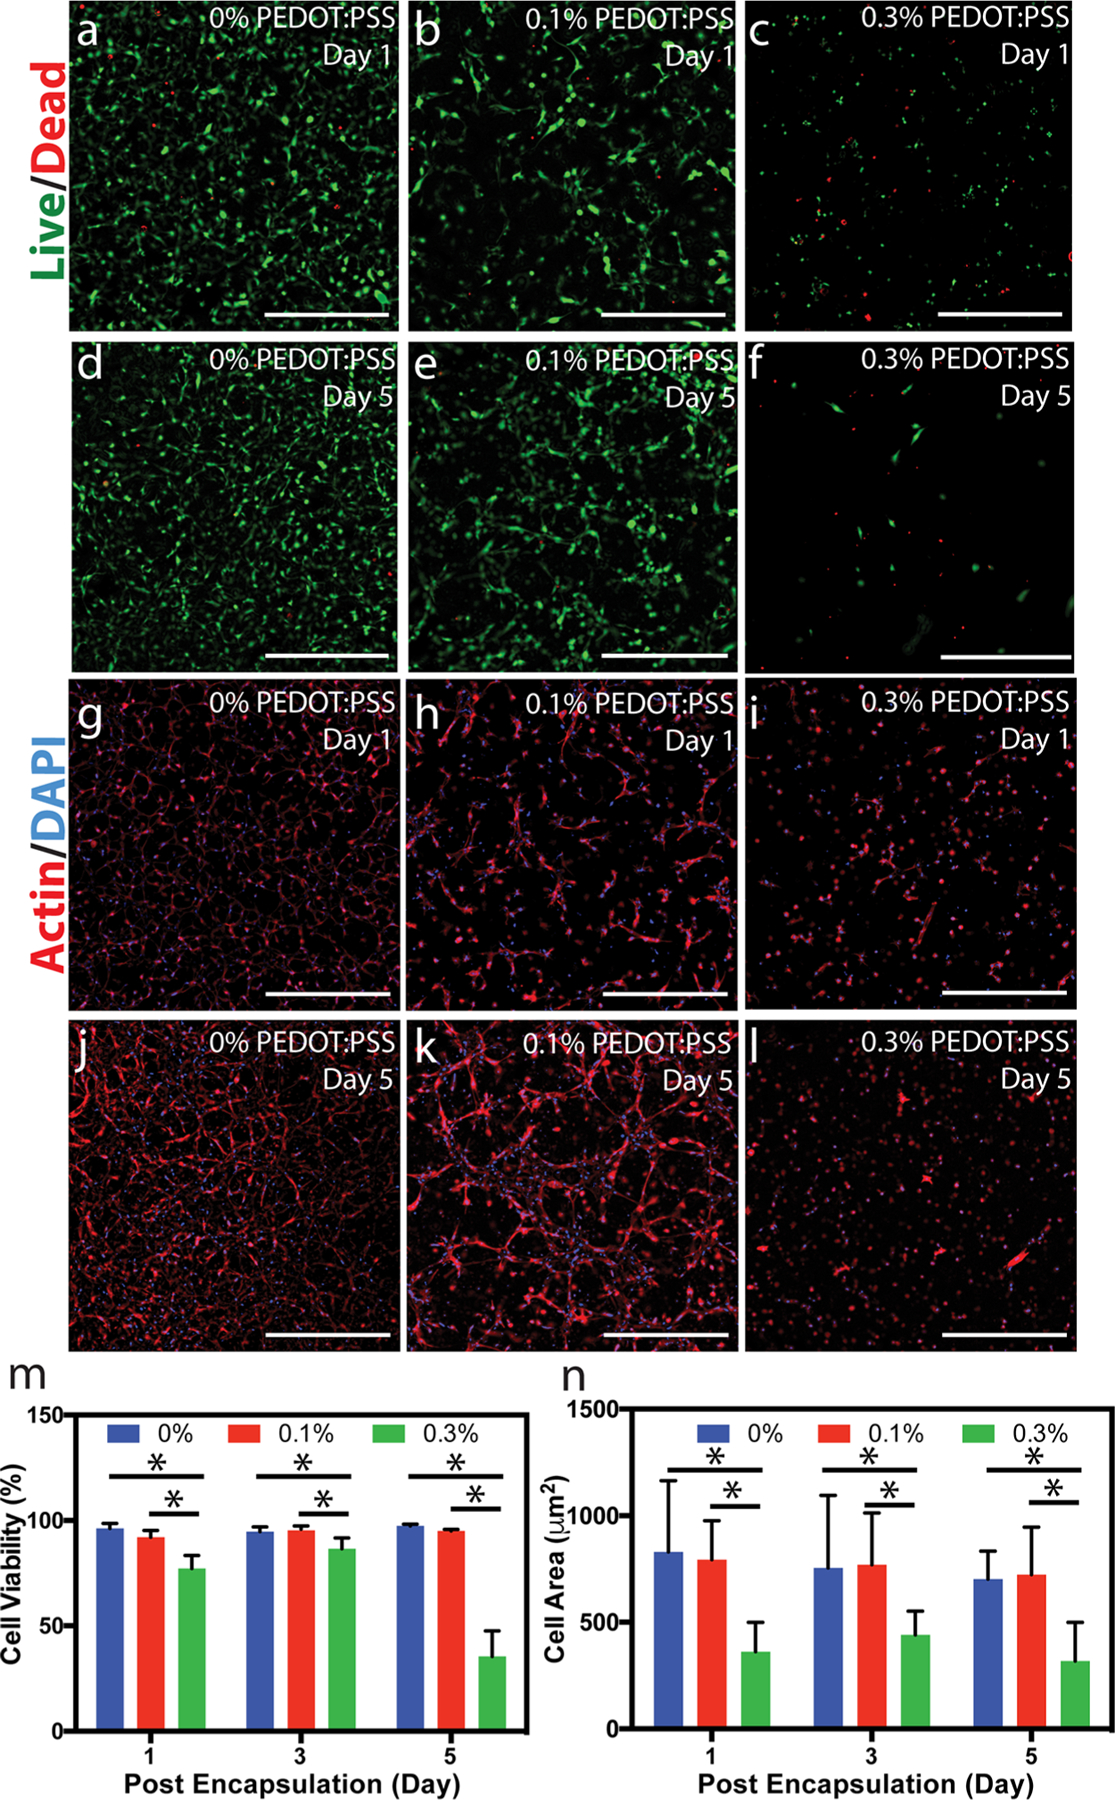
3D cell encapsulation in GelMA/PEDOT:PSS hydrogels. Representative Live/Dead images from C2C12 cells encapsulated in (a, d) 0, (b, e) 0.1, and (c, f) 0.3% PEDOT:PSS over 5 days of culture (scale bars = 500 μm). Representative Actin/DAPI images from C2C12 cells encapsulated in (g, j) 0, (h, k) 0.1, and (i, l) 0.3% PEDOT:PSS over 5 days of culture (scale bars = 500 μm). (m) Quantification of viability for cells encapsulated in GelMA hydrogels containing varied concentration of PEDOT:PSS at different days (* = p < 0.05).(n) Quantification of cell spreading, defined as the area of cell clusters divided by the number of cells within those clusters, for cells encapsulated in GelMA hydrogels containing varied concentration of PEDOT:PSS at different days (* = p < 0.05).