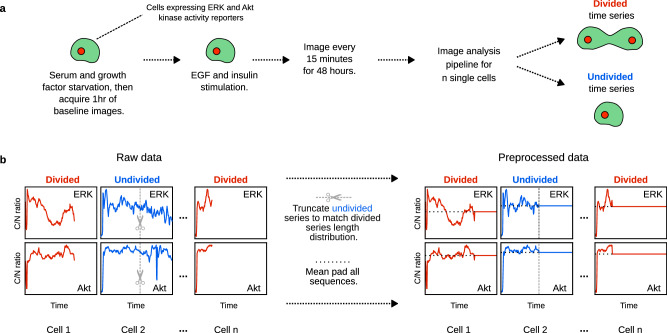
Fig. 1. Overview of input data and their processing.
a Experimental workflow of MCF10A data generation: Initially, cells expressing ERK and Akt reporters were serum- and growth factor-starved. An hour of baseline images were taken immediately before growth factor treatment. After treatment with epidermal growth factor (EGF) and insulin, cells were imaged every 15 minutes for 2 days, and the resultant image time courses were analyzed to measure kinase activity (cytoplasmic to nuclear fluorescence ratio of the kinase translocation reporter (KTR) (C/N ratio)). Time courses were labeled as divided or undivided according to the fate of the corresponding cell. b Pre-processing kinase time course data for machine learning analyses: Divided cells had a truncated time course at the time of cell division, whereas undivided cells did not. To address this incompatibility, all undivided cell time courses were truncated so that the distribution of time series lengths were the same between the two classes. Each time course was then padded to lengths equal to those of the undivided cell with the corresponding mean.

