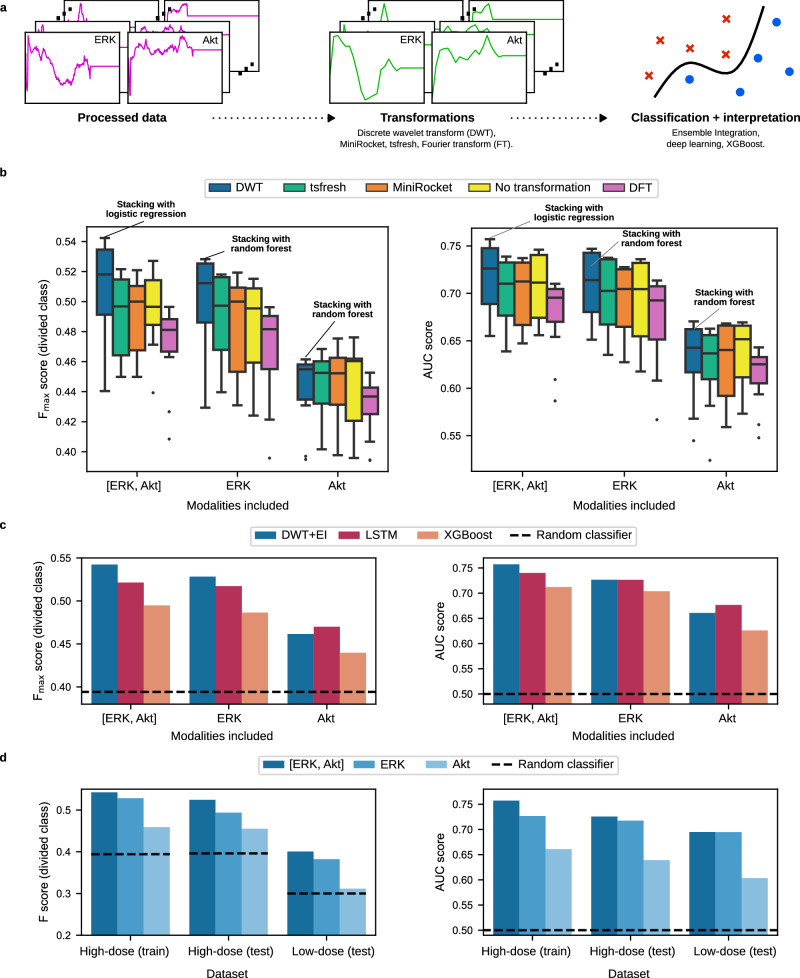
Fig. 2. Cross-validated performance and testing of cell fate classification methods.
a High-level overview of the machine learning analyses used. Processed data were subjected to time course transformations to enhance the signal in the ERK and Akt time courses individually, before being used as input to several machine learning classification algorithms. b Box plots showing the performance distribution of a family of ensembles developed by Ensemble Integration (EI) in combination with various transformations, as well as the multi-modal [ERK, Akt] time course. Centre lines and bounds of boxes correspond to the median and upper/lower quartiles, respectively. Whiskers denote maximum/minimum values within 1.5 times the interquartile range above/below the upper/lower quartile, with values outside this range (points) denoting outliers. c Performance of the most predictive EI algorithm combined with the Discrete Wavelet Transformation (DWT) named in b with arrows, as well as other established classification algorithms, namely Extreme Gradient Boosting (XGBoost) and deep learning-based Long Short Term Memory (LSTM). Both sets of results are presented in terms of the and AUC evaluation measures. To calculate the score, we maximized the F-measure on the training set, and then applied this threshold to discretize the test set predictions and calculate the F-measure value there. Note that the classifier with the best score does not necessarily also have the best AUC score. The performance of a random classifier is shown for reference. d F-measure and AUC scores of the final DWT+EI classification models on the MCF10A train and test sets. The performance of a random classifier is shown for reference. These results show that ERK is substantially more predictive than Akt across all datasets, but utilizing both ERK and Akt time courses is even more predictive.

