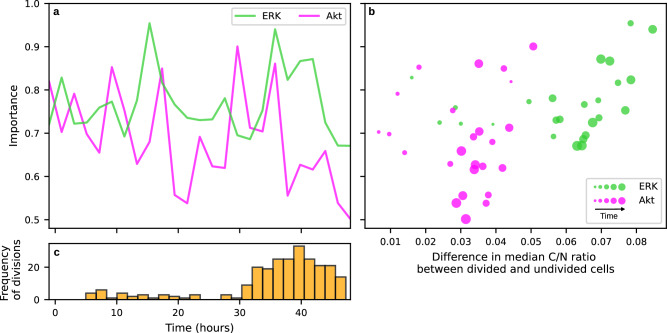
Fig. 3. Interpretation of the multi-modal [ERK, Akt] cell fate prediction model.
a The respective predictive importances of ERK and Akt activities, demonstrating that time points of high importance (higher values on the Y-axis) exist throughout the time course, in particular for ERK. b A scatter plot showing the importance scores of ERK and Akt activities against the differences between the median C/N ratios of the corresponding reporter for the cell fate classes (dividing and non-dividing) during the same time course, with a larger point size indicating a later time point. The most predictive/important time points in a were generally consistent with large differences in the median C/N ratios between cell fate classes. c Distribution of cell division times in the High-dose (train) dataset, showing that the division times of dividing cells were localized towards the end of the 48 hour period.

