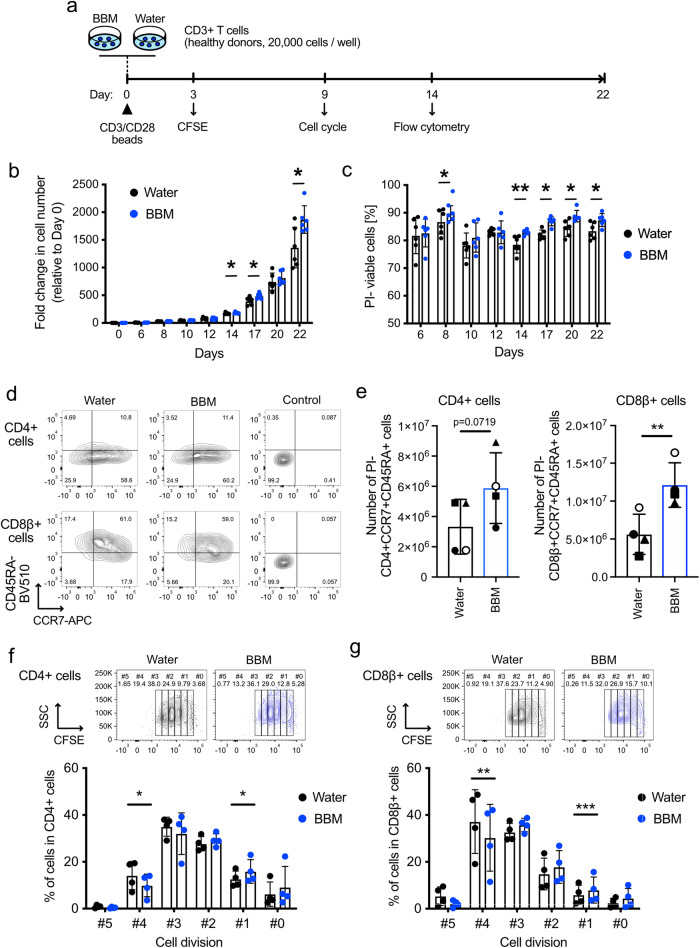
Fig. 2. Effects of BBM on human healthy donor-derived T cells.
a Experimental scheme for characterizing the effect of BBM on primary CD3+ T cells. b Fold changes in cell number and c viability determined using the standard trypan blue method. Error bars indicate SD from six donors. d Representative FACS plots illustrating the expression of CCR7 and CD45RA in CD4+ cells (top) and CD8β+ cells (bottom) on day 14. e Estimated numbers of CD4+CCR7+CD45RA+ cells (left) and CD8β+CCR7+CD45RA+ cells (right) in cultured CD3+ T cells calculated from the total cell number and frequencies of the populations that are PI- on day 14. f, g Results of the CFSE assay in CD4+ (f) and CD8β+ (g) fractions within CD3+ cells on day 3. Error bars indicate SD from six (b, c) or four donors (e–g). Statistical significance is denoted as follows: *p < 0.05; **p < 0.01; and ***p < 0.001 (paired t-test).

