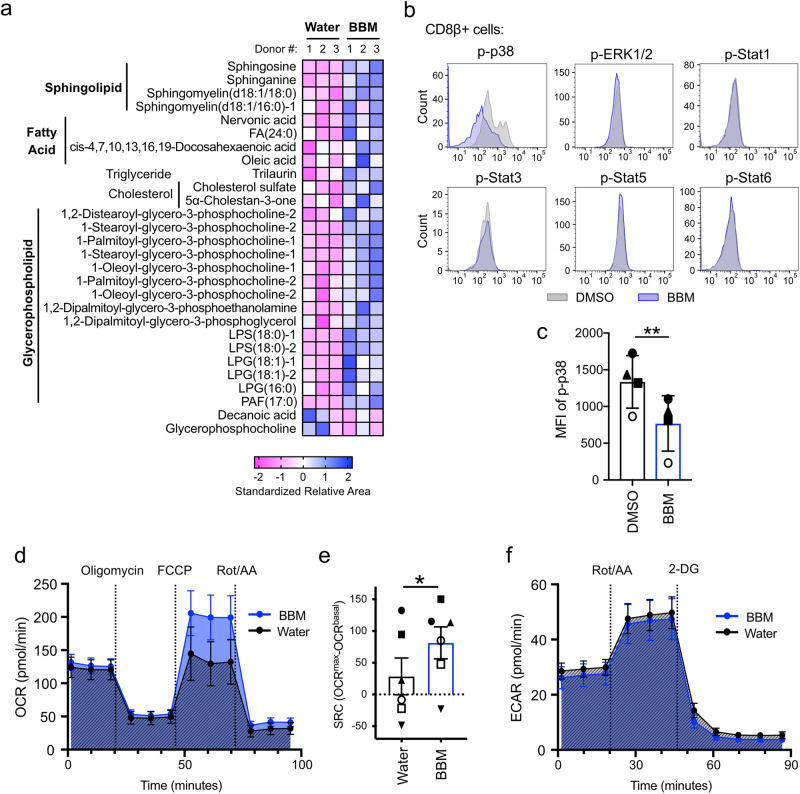
Fig. 5. Effect of BBM on metabolism and signaling pathways in primary T cells.
a Metabolomics of BBM-treated TSCM cells from healthy donor-derived CD8+ cells. Lipids commonly upregulated or downregulated in all three donors are shown. b Representative flow cytometry plots of Phosflow assay in BBM-treated CD3+ cells on day 10. Phosphorylated proteins in CD8+ T cells are shown. c Mean fluorescence intensity (MFI) of phosphorylated p38 in CD8+ T cells. Error bars indicate SD from four donors. d Oxygen consumption rate (OCR) across time for BBM-treated CD3+ T cells. e Spare respiratory capacity (SRC) calculated by OCRmax-OCRbasal. f Extracellular acidification rates (ECAR) across time for BBM-treated CD3+ T cells. Error bars indicate the standard error of the mean from six donors (d–f). Statistical significance is denoted as follows: *p < 0.05; **p < 0.01; and ***p < 0.001 (paired t-test) (c, e).

