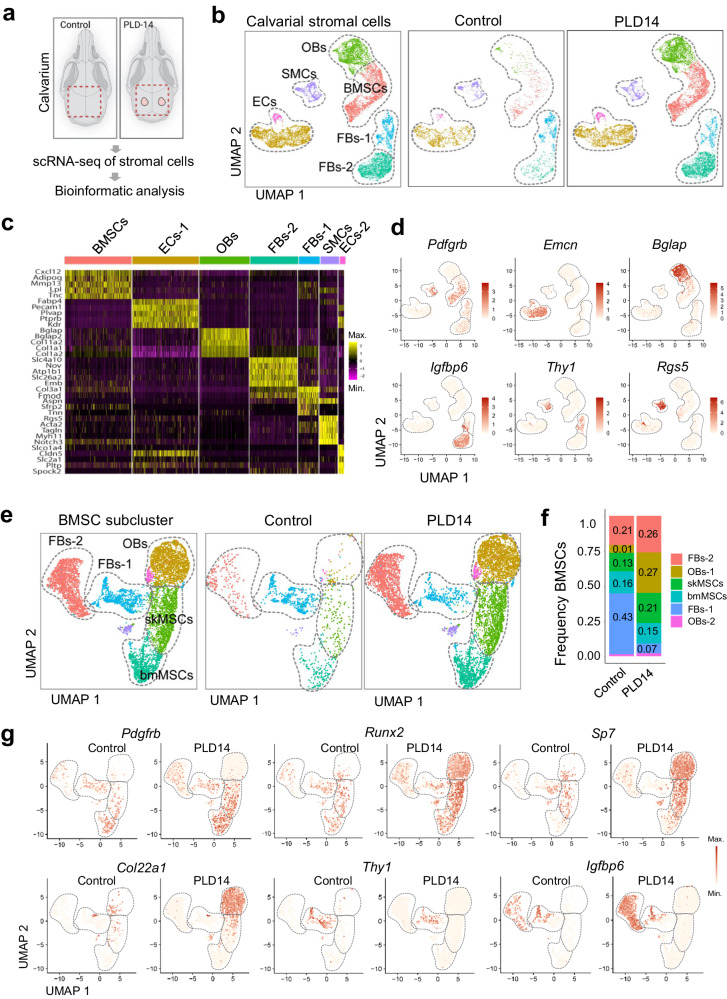
Fig. 8. Single cell RNA-sequencing analysis of bone non-hematopoietic cells after calvarial bone injury.
a Preparation of calvarial bones at PLD14 for scRNA-seq data analysis. b UMAP plots showing color-coded merged cell clusters from calvarial bones at PLD14 (left), group-selected color-coded cell clusters from controls (middle) and calvarial bone lesions (right). c Heat map showing top cell marker genes of each cell population shown in (b). d Cell-specific marker genes (Pdgfrb - BMSCs, Emcn - ECs, Bglap - OBs, Igfbp6 - FBs-2, Thy1 - FBs-2, Rgs5 - SMCs) as shown in feature plots (b). e UMAP plots of BMSCs subcluster showing color-coded merged cell clusters from calvarial bones at PLD14 (left), group-selected color-coded cell clusters from controls (middle) and calvarial bone lesions (right). f Frequency plots of color-coded BMSC subcluster at PLD14 shown in (e). g BMSCs subcluster from control and PLD14 data displayed in UMAP plot (e). bmMSCs/skMSCs (Pdgfrb, Runx2) and osteoblasts and progenitors (Runx2, Sp7, Col22a1) are increased in PLD14 bone relative to control. FBs-1 (Thy1) are not altered and FBs-2 (Igfbp6) are strongly increased in PLD14 bone relative to control.

