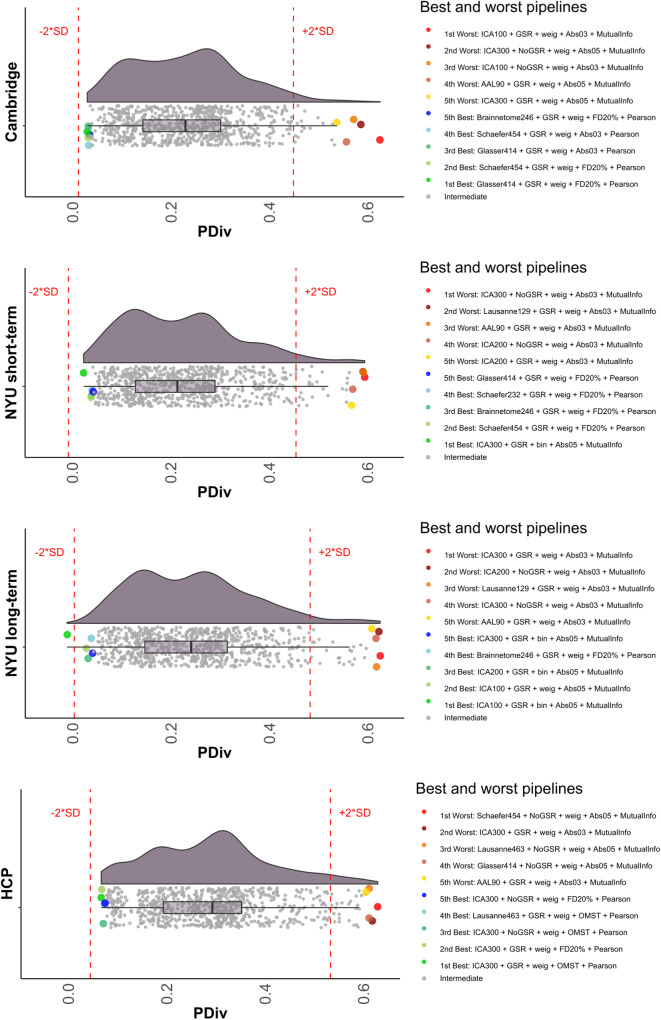
Fig. 2. Distribution of group-average portrait divergence values for each of 768 alternative network construction pipelines, across different time intervals.
From top to bottom: Cambridge dataset (rescan within 2–4 weeks). NYU short-term dataset (rescan within 45 minutes). NYU long-term dataset (rescan within 16 months; average 11.4); HCP dataset (rescan 1–11 months). Right-side: highlighting the top 5 (lowest PDiv) and bottom 5 performers (highest PDiv). Each data-point represents one pipeline (n = 768). Red lines mark 2 standard deviations from the mean of the distribution. Box plot centre line, median; box limits, upper and lower quartiles; whiskers, 1.5x interquartile range. GSR Global Signal Regression, OMST Orthogonal Minimal Spanning Trees, PDiv Portrait Divergence. Source data are provided as a Source Data file.

