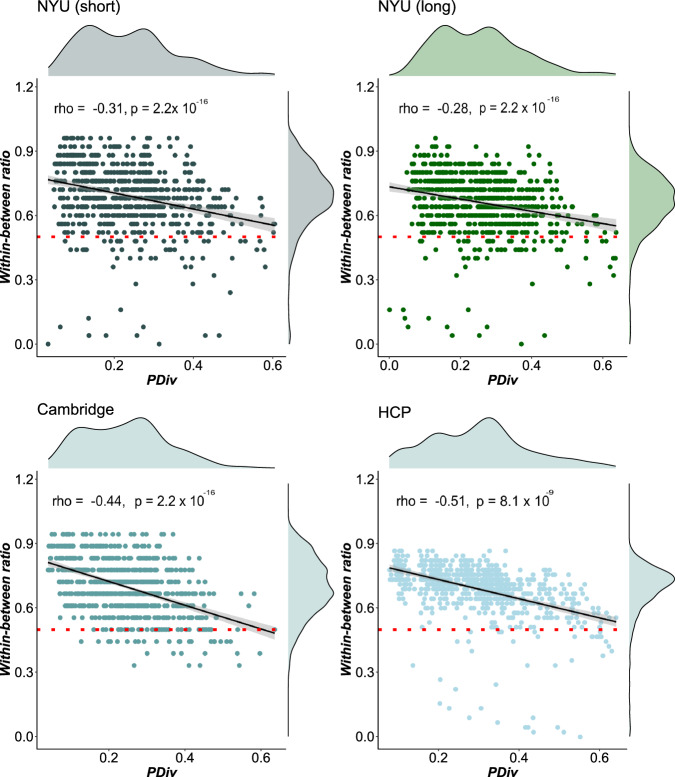
Fig. 5. PDiv within versus between individuals.
Pipeline PDiv (portrait divergence) in a given dataset is plotted against the proportion of participants in the same dataset for whom the within-subject PDiv (baseline vs follow up) is smaller than between-subject PDiv. Each data-point represents one pipeline (n = 768). Pipelines above the red line meet the within-between criterion such that portrait divergence is smaller for within-subject test–retest compared to between subject comparisons. Shading indicates standard error of the fitted line to model the linear relationship between the two respective variables. Spearman correlation coefficient (two-sided) is used to assess the strength of relationship and its statistical significance. Source data are provided as a Source Data file.

