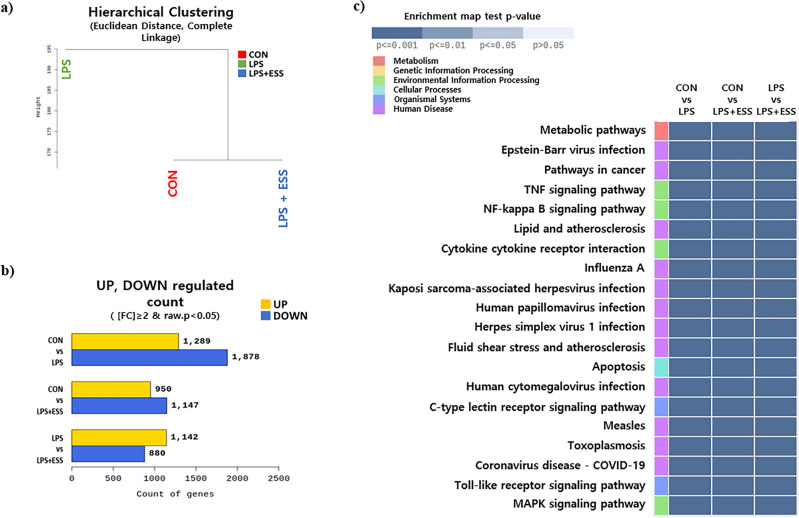
Figure 2.
Analysis of gene expression modulation by ESS in LPS-treated RAW 264.7 cells using RNA sequencing. RNA sequencing analysis of RAW 264.7 cells treated with/without LPS or LPS + ESS. (a) Hierarchical clustering analysis for each sample and (b) the number of significant genes for each group is indicated based on fold change and p-value. (c) The heat map shows the KEGG pathway analysis result of RNA sequencing treated with ESS on LPS-treated macrophages. Among altered pathways of the LPS + ESS group vs. the LPS group, cell signaling pathways with significantly different gene expression (p-value < 0.001) between groups were selectively shown.

