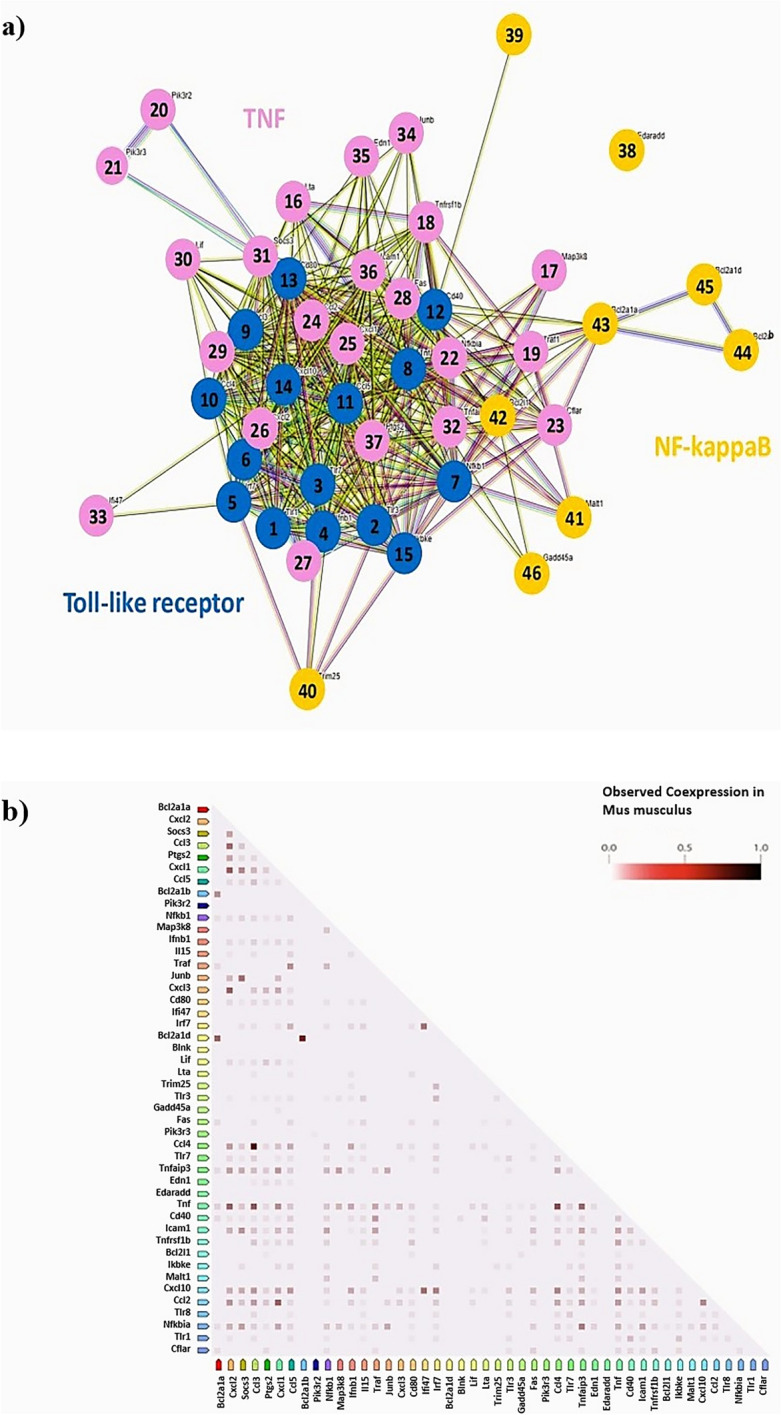
Figure 3.

Protein network analysis of representative inflammatory signaling-related genes downregulated by ESS. We performed protein network analysis using genes associated with the Toll-like receptor signaling pathway, TNF signaling pathway, and NF-kappa B signaling pathway that were downregulated by ESS. (a) Toll-like receptor signaling pathway (genes 1 to 15: Tlr1, Tlr3, Tlr7, Ifnb1, Irf7, Tlr8, Nfkb1, Tnf, Ccl3, Ccl4, Ccl5, Cd40, Cd80, Cxcl10, Ikbke), TNF signaling pathway (genes 16 to 37: Lta, Map3k8, Tnfrsf1b, Traf1, Pik3r2, Pik3r3, Nfkbia, Cflar, Ccl2, Cxcl1, Cxcl2, Cxcl3, Fas, Il15, Lif, Socs3, Tnfaip3, Ifi47, Junb, Edn1, Icam1, Ptgs2), NF-kappa B signaling pathway (genes 38 to 46: Edaradd, Blnk, Trim25, Malt1, Bcl2l1, Bcl2a1a, Bcl2a1b, Bcl2a1d, Gadd45a). (b) Analysis of the correlation between genes associated with co-expression.
