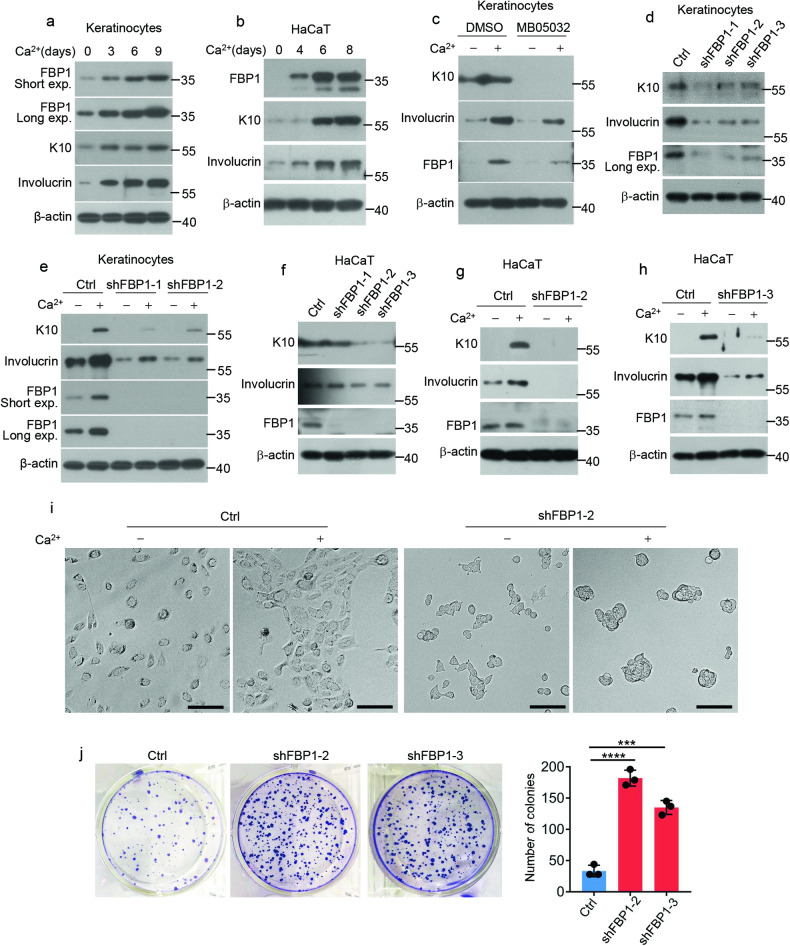
Fig. 4. FBP1 promotes differentiation and inhibits proliferation of keratinocytes.
a Human primary keratinocytes were treated with CaCl2 (1.2 mM) for 0, 3, 6 or 9 days before collection. The indicated proteins were detected by western blots. Exp, exposure. b HaCaT cells were treated with CaCl2 (1.2 mM) for 0, 4, 6 or 8 days before collection. The indicated proteins were detected by western blots. c Human primary keratinocytes were treated with DMSO or 40 μM MB05032 for 2 days and then exposed to 0.06 mM (−) or 1.2 mM (+) calcium for 3 days before collection. The indicated proteins were detected by western blots. d Ctrl shRNA or FBP1 shRNAs (shFBP1-1, shFBP1-2, shFBP1-3) were packaged into lentiviral particles and transduced into keratinocytes. The positive clones were selected by puromycin (2 µg/ml). The indicated proteins were detected by western blots. Exp, exposure. e Keratinocytes stably expressing Ctrl shRNA or FBP1 shRNAs (shFBP1-1, shFBP1-2) were exposed to 0.06 mM (−) or 1.2 mM (+) calcium for 3 days before collection. The indicated proteins were detected by western blots. Exp, exposure. f Ctrl shRNA or FBP1 shRNAs (shFBP1-1, shFBP1-2, shFBP1-3) were packaged into lentiviral particles and transduced into HaCaT cells. The positive clones were selected by puromycin (2 µg/ml). The indicated proteins were detected by western blots. g, h HaCaT cells stably expressing Ctrl, shFBP1-2 (g) or shFBP1-3 (h) were exposed to 0.06 mM (−) or 1.2 mM (+) calcium for 6 days before collection. The indicated proteins were detected by western blots. i HaCaT cells stably expressing Ctrl or shFBP1-2 were exposed to 0.06 mM (−) or 1.2 mM (+) calcium for 3 days before observation by microscopy. Scale bars: 50 µm. j HaCaT cells stably expressing Ctrl or shFBP1-2 were plated (1000 cells/well) and cultured for 2 weeks. The colonies were stained with 0.1% crystal violet and counted, n = 3 independent experiments. Data are shown as mean ± s.d. Statistical analyses in (j) were performed with Student’s t-tests. ***p < 0.001, ****p < 0.0001.

