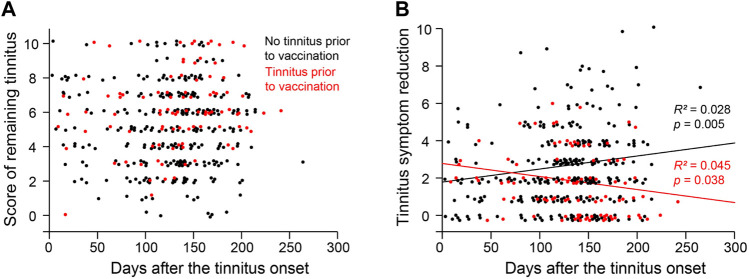
FIGURE 3.
Distribution of Tinnitus severity over time. (A) The score of remaining tinnitus as a function of the duration/days from the tinnitus onset to the time of the survey. (B) The reduction of the tinnitus score from its peak level to the remaining level as a function of the duration/days from the tinnitus onset to the time of the survey.

