
FIGURE 2.
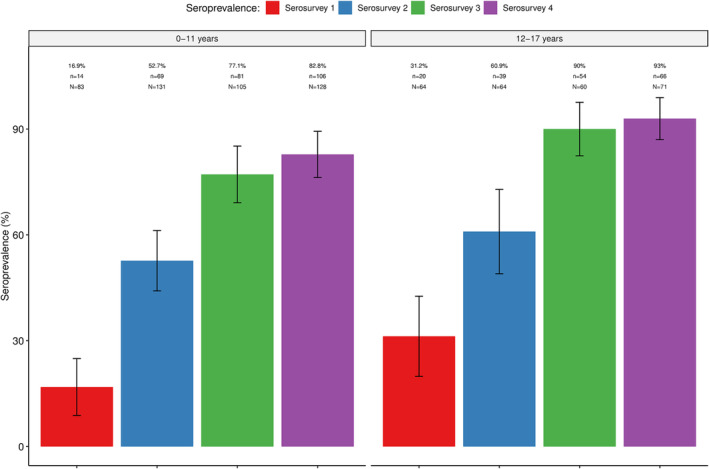
Seroprevalence of SARS‐CoV‐2 antibodies in four community‐based seroepidemiological surveys in age groups not eligible for vaccination. % = prevalence of seropositives; n = absolute number of positives per age group; N = total sample size per age group.