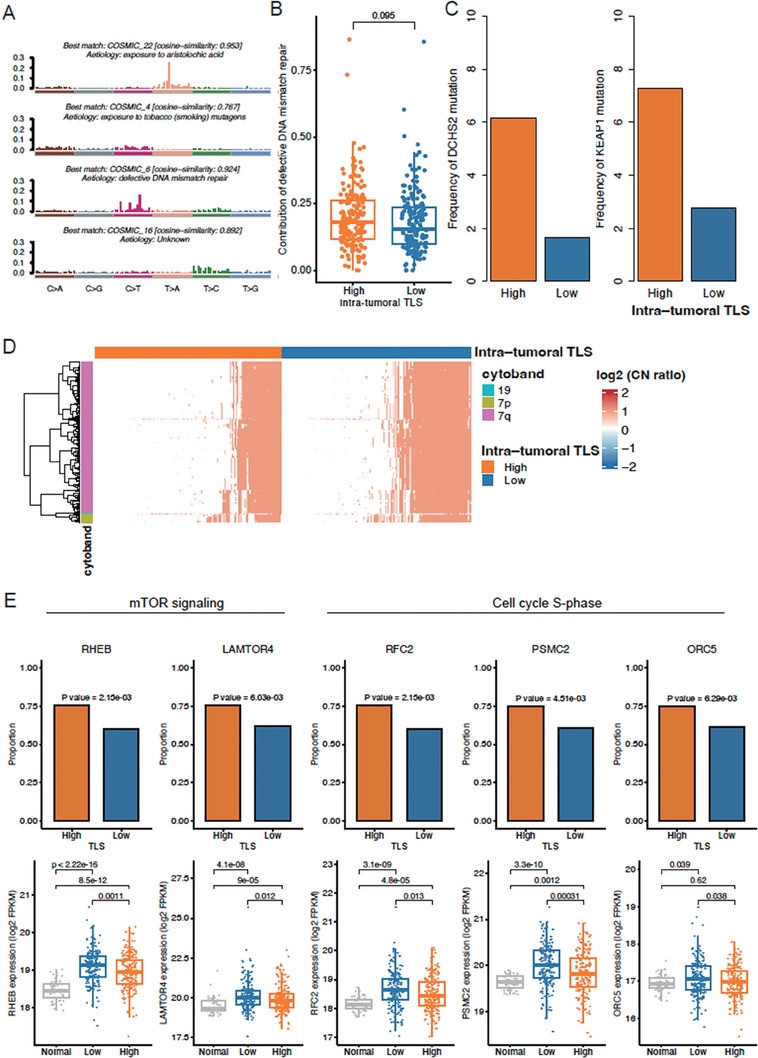
Figure 7.

Genomic characteristics of HCC tissues with high and low intra‐tumoral TLS. A) The etiologies identified by the mutational signatures in TCGA HCC. B) The differential contribution of defective DNA mismatch repair between TLS‐high (n = 179) and TLS‐low (n = 180) groups. The p‐value was calculated by Wilcoxon rank sum test. C) The differential frequencies of DCHS2 and KEAP1 mutations between TLS‐high and TLS‐low groups. The p‐value was calculated by Chi‐square test. D) The genes preferentially amplified or deleted in TLS‐high or TLS‐low group. The color bands on the left represent the cytobands that the genes located within. The red and blue colors in the heatmap represent highly amplified and deleted, respectively, and the white represents the copy number neutral. The color bands on the top represent the TLS‐high and TLS‐low groups. E) The differential frequency and expression levels of amplified genes between normal and TLS‐high and TLS‐low HCC‐LT groups. The significances of differential frequency and expression levels were assessed by Chi‐square test and Wilcoxon rank sum test, respectively.
