
Figure 9.
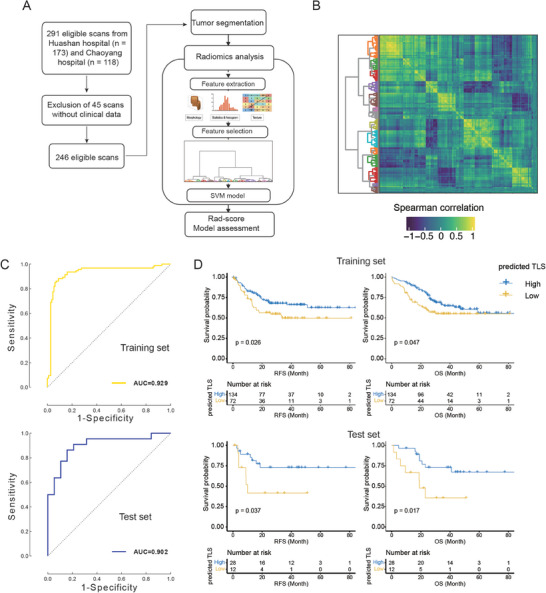
The radiomics‐based model for TLS abundance prediction. A) The workflow for the construction of radiomics‐based model (n = 246). B) The spearman correlation between the features was calculated from the radiomic data. C) The model performance in the training (top) and validation (bottom) sets was assessed by the ROC curve/AUC value. D) The Kaplan–Meier curves and the number of cases at risk for the high and intra‐tumoral TLS groups predicted by the radiomic model (top: the training set, bottom: the test set).