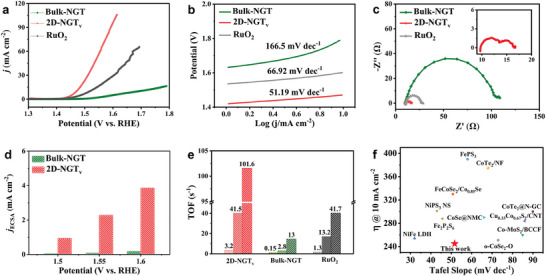
Figure 3.

Electrochemical characterizations of Bulk‐NGT and 2D‐NGTv. a) LSV curves, b) the Tafel plots, and c) the EIS spectra (at 1.65 V vs RHE) of Bulk‐NGT, 2D‐NGTv, and the references. d) ECSA normalized OER activity and e) TOF values (at the overpotentials of 200, 300, and 400 mV) of Bulk‐NGT, 2D‐NGTv, and RuO2, respectively. f) OER performance comparison between 2D‐NGTv and the reported OER electrocatalysts at the current density of 10 mA cm−2.
