
Figure 3.
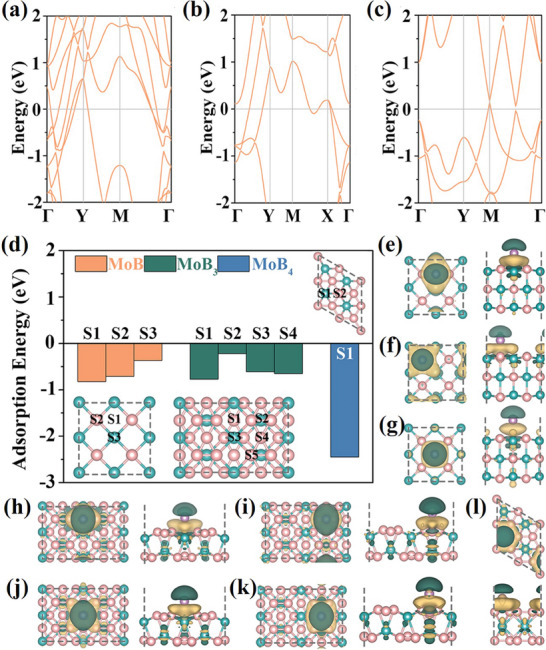
a−c) Electronic band structures of the MoBx (x = 1, 3, and 4) monolayers; d) Adsorption energies of Li on the MoBx (x = 1, 3, and 4) monolayers. The insets show the considered adsorption sites. Top and side views of the charge redistributions induced by the interaction of Li at the e) S1, f) S2, and g) S3 sites with the MoB monolayer, by the interaction of Li at the h) S1, i) S2, j) S3, and k) S4 sites with the MoB3 monolayer, and by the interaction of Li at the l) S1 site with the MoB4 monolayer. Green and yellow isosurfaces (isovalue: 0.01 electrons Å−3) represent charge depletion and accumulation, respectively. Reproduced under terms of the CC‐BY 4.0 license.[ 27 ] Copyright 2022. Springer Nature.