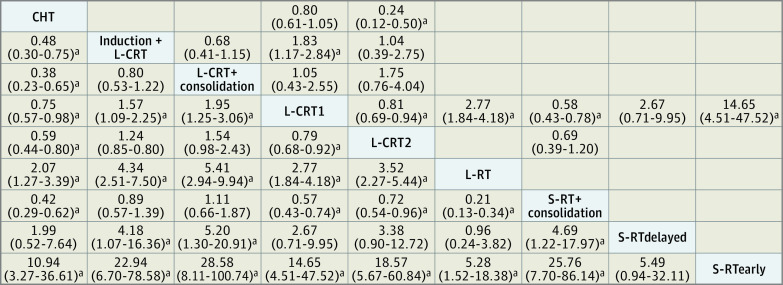
Figure 2. League Table for the Primary Outcome of Pathological Complete Response.
Treatments included in the analysis are shown in boldface on a diagonal in alphabetical order. Results of the network meta-analysis are reported in the lower left part of the matrix, and results from the pairwise meta-analysis are reported in the upper right matrix of the table. Each cell presents the relative risk (RR) and the corresponding 95% CI, and RRs greater than 1 favor the column-defining treatment (ie, the left-most cell on the diagonal).
aSignificant RR (95% CI).

