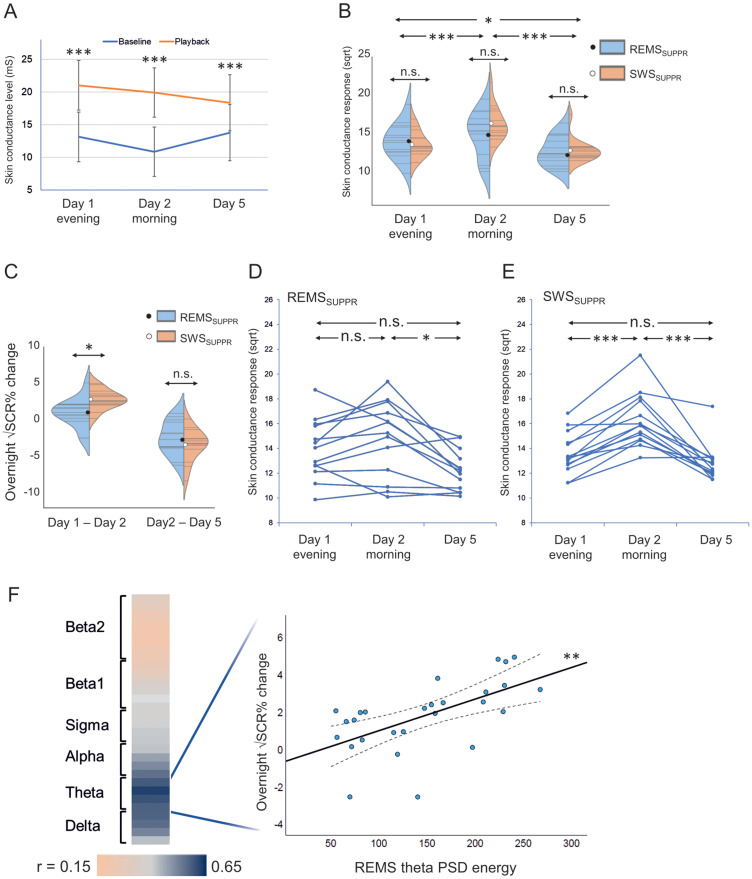
Figure 3.
Skin conductance, suppression condition, and REMS oscillations. The playback of the karaoke recording induced a significant rise in SCL in all measurements (p < 0.001, Bonferroni-corrected; A). Violin plots illustrate individual (gray lines) and condition-wise (blue/orange) distributed SCRs with mean values (black/white dot) across the three measurements (B). Overnight change in SCR was higher in SWSSUPPR than in REMSSUPPR (p = 0.016, Bonferroni-corrected; C). Individual trajectories of SCRs in REMSSUPPR (D) and in SWSSUPPR (E). The scatterplot illustrates the positive association between REMS theta power spectral density (PSD) energy and overnight SCR change (p = 0.002, Bonferroni-corrected), and the heatmap displays Pearson’s correlation strength across 0–30 Hz for REMS (F). Error bars and dashed lines: 95% confidence interval. ***p < 0.001; **p < 0.01; *p < 0.05; Bonferroni-corrected. Extended Data Figure 3-1 displays the excluded outliers.

