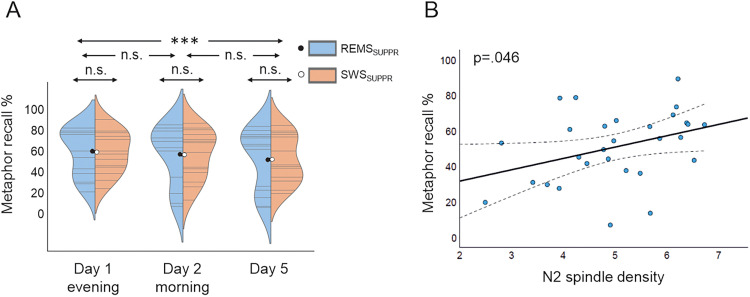
Figure 5.
Metaphor recall. A violin plot illustrates individual (gray lines) and condition-wise (blue/orange) distributed metaphor recall percentages with mean values (black/white dot) across the three measurements (A). N2 fast spindle density predicted positively overall metaphor recall (averaged across all retrievals; p = 0.046, Bonferroni-corrected) (B). Dashed lines: 95% confidence interval.

