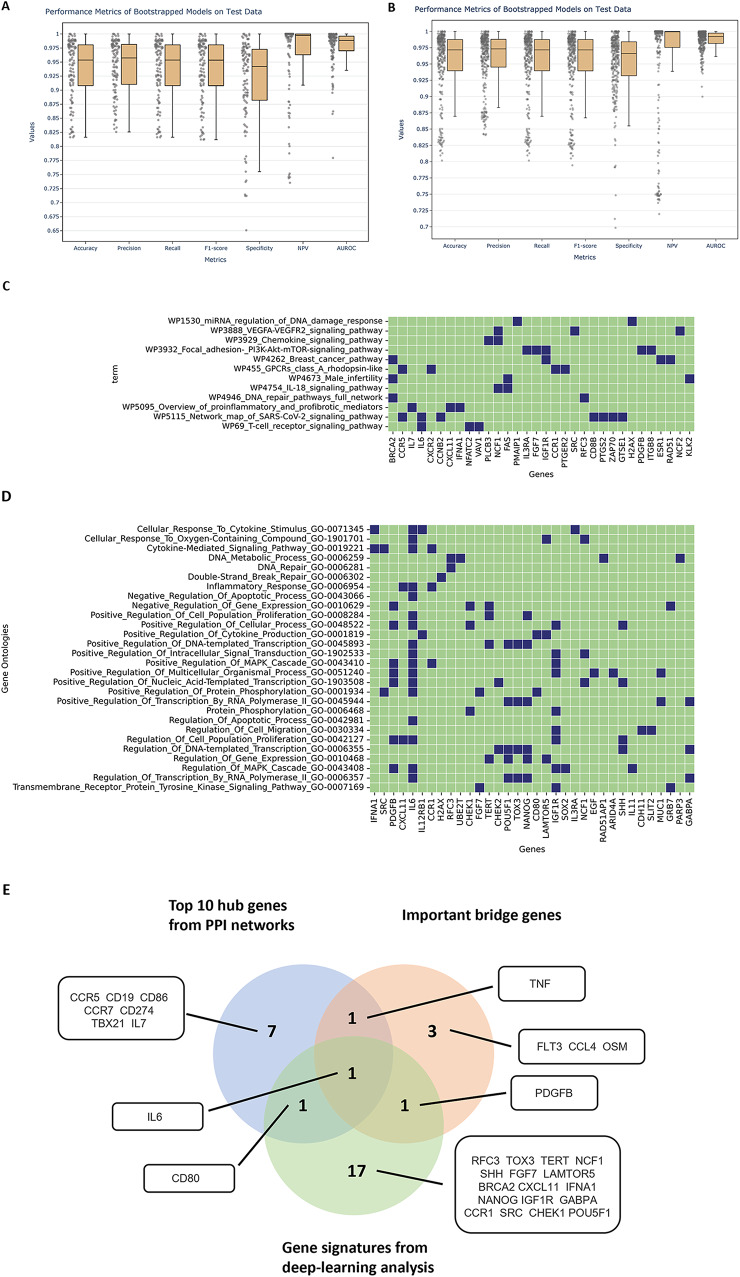
Fig. 5.
Identifying gene signatures of recurrent HCC tumors using pathway-centric modeling. (A) Performance metrics of bootstrapped pathway models on the test data, (B) Performance metrics of bootstrapped GO term models on the test data. Overall, both pathway and GO term-based models achieved good performance on test data with accuracy, precision, recall (sensitivity) metrics > 0.80. (C), (D) Genes in corresponding pathway and GO term that the models used to distinguish between primary and recurrent tissue. (E) Overlapping genes between gene signatures from deep learning-based analysis, important bridge genes and the top 10 hub genes from PPI networks

