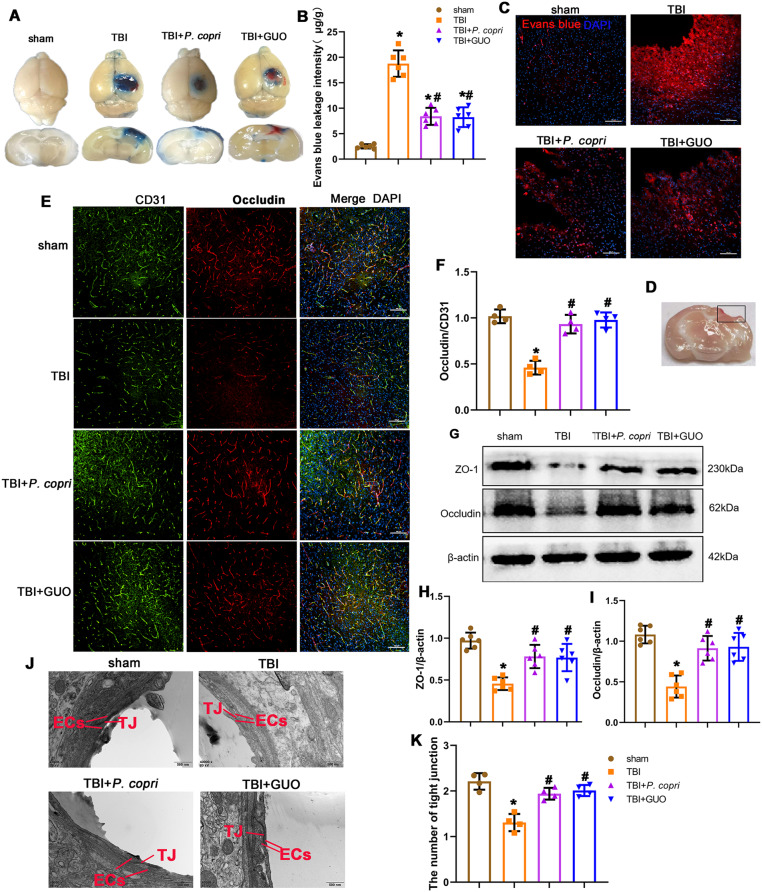
Fig. 8.
P. copri treatment attenuated BBB disruption after TBI. A. Representative horizontal and coronal images of brain slices after EB injection. B. Quantitative analysis of EB leakage intensity. *p, < 0.05 vs. sham; #, p < 0.05 vs. TBI, n = 6 per group. C. Red fluorescence of EB was observed by fluorescence microscopy in different groups. Cell nuclei were stained with DAPI (blue). Scale bar = 100 μm. n = 4 per group. D. Brain sample with a schematic illustration showing the area (indicated by the black box) that was used for the immunofluorescence analysis. E. Representative images of double immunofluorescence staining for Occludin and CD31, nuclei were stained with DAPI (blue). Scale bar = 100 μm. F. Quantitative analysis of relative Occludin fluorescence intensity in different groups. *, p < 0.05 vs. sham; #, p < 0.05 vs. TBI, n = 4 per group. G. Representative Western blot bands of ZO-1, Occludin and β-actin at the lesion sites after TBI. H-I. Quantitative analysis of relative ZO-1 (H), Occludin (I) density. *, p < 0.05 vs. sham; #, p < 0.05 vs. TBI, n = 6 per group. J. Transmission electron microscopy showed the ultrastructure of tight junctions. Scale bar = 500 nm. EC: Endothelial cells. TJ: Tight junction. K. Quantitative data show a decreased number of organized tight junctions. *, p < 0.05 vs. sham; #, p < 0.05 vs. TBI, n = 4 per group. One-way ANOVA was used to compare the means of different groups followed by a Tukey post hoc multiple-comparisons test

