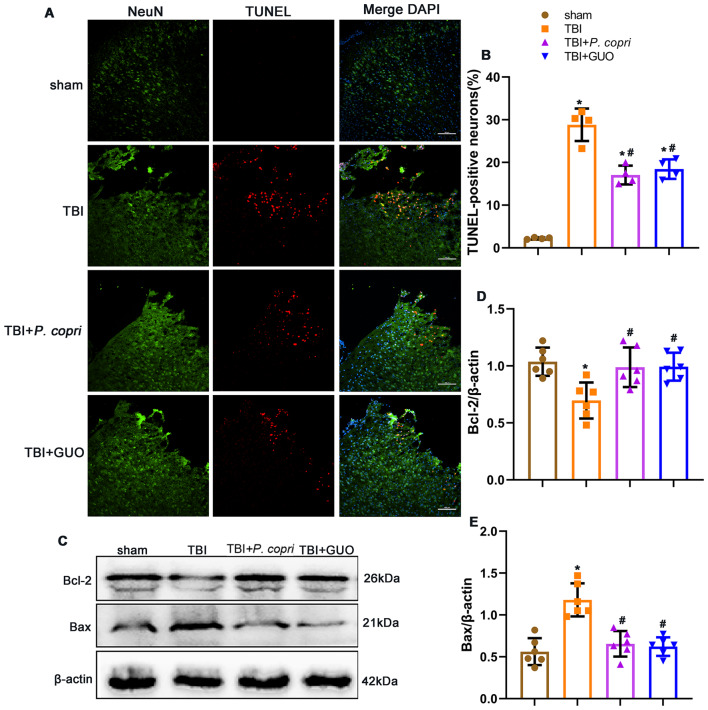
Fig. 9.
P. copri treatment attenuated neuronal apoptotic death and expression of apoptosis-related proteins after TBI. A. Representative images of dead cells (TUNEL, red) and neurons (NeuN, green) surrounding the lesion sites. Scale bar = 100 μm. B. Quantitative analysis of TUNEL-positive neurons surrounding lesion sites after TBI. *, p < 0.05 vs. sham; #, p < 0.05 vs. TBI, n = 4 per group. C. Representative Western blot bands of Bcl-2, Bax and β-actin at the lesion sites after TBI. D-E. Quantitative analysis of Bcl-2 (D) and Bax (E) density at the lesion sites after TBI. *, p < 0.05 vs. sham; #, p < 0.05 vs. TBI, n = 6 per group. One-way ANOVA was used to compare the means of different groups followed by a Tukey post hoc multiple-comparisons test

