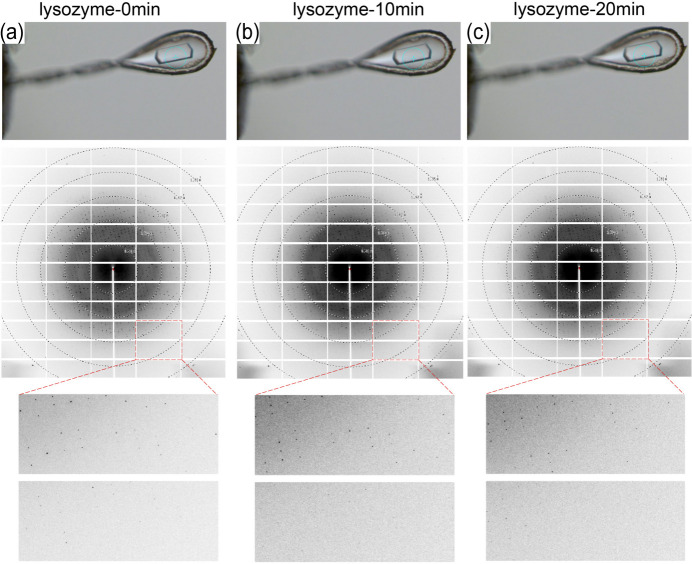
Figure 4.
Sequential depictions of the impact of the HC on a lysozyme crystal during an experiment. (a) ‘lysozyme-0 min’ illustrates the crystal’s initial state and the corresponding diffraction pattern. (b) ‘lysozyme-10 min’ reflects the crystal’s condition 10 min after activating the HC. (c) ‘lysozyme-20 min’ captures the crystal’s state 20 min after activating the HC.

