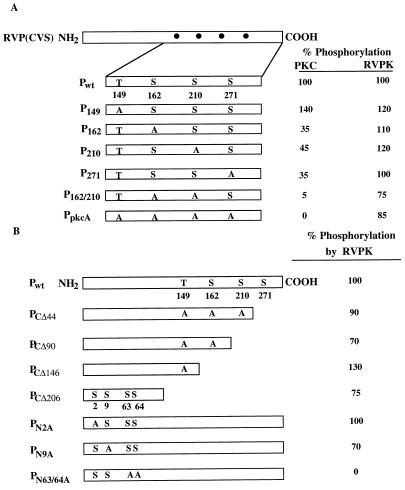
FIG. 6.
Determination of P phosphorylation sites for RVPK. (A) A diagram of the entire P protein is shown at the left hand; the dots represent computer-predicted PKC sites. An enlargement of that region shows the positions of one threonine (T) and three serine (S) residues. The mutant P proteins at these sites are shown. PpkcA is the mutant P protein in which all four sites were changed to alanine. Phosphorylation of each mutant as a percentage of the wild-type level is shown at the right. PKC (DE-UB) and RVPK (HS-B) were used for analyses. (B) The entire P protein is drawn schematically along with the computer-predicted PKC sites. Subscript numbers in C-terminal mutant designations represent the number of amino acids deleted from the C terminus. The mutated serines and threonine in the PKC motif are shown. The number in the subscript of each N-terminal mutant designation denotes the position of serine altered to alanine, keeping the PKC motifs unaltered. Percent phosphorylation of each mutant by purified RVPK (HAP-B) is shown at the right.

