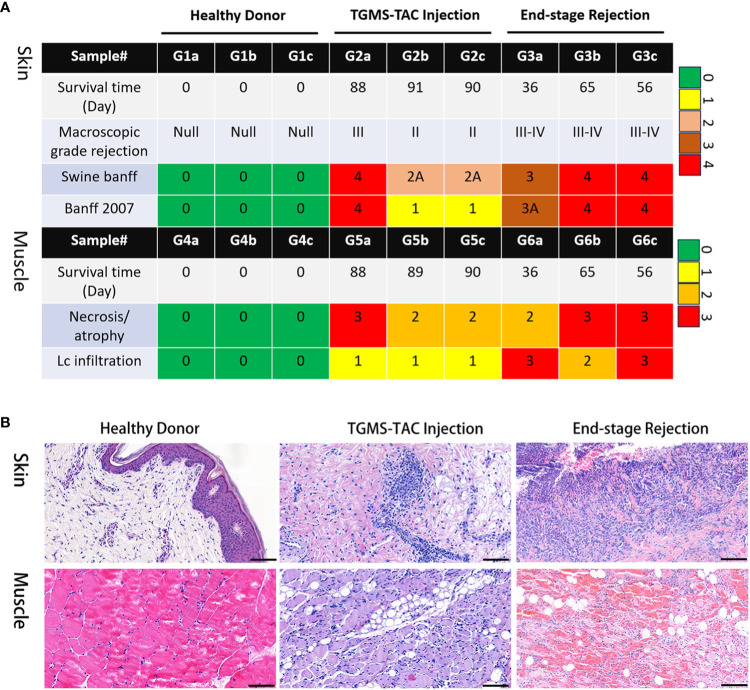
Figure 1.
Histological evaluation of VCA rejection. (A) Pathological scoring of VCA rejection samples, with TGMS-TAC treated group exhibiting lower scores in both skin and muscle tissues in comparison to the untreated rejection group. (B) Representative images showcasing the pathological features of rejection in skin and muscle tissues.

