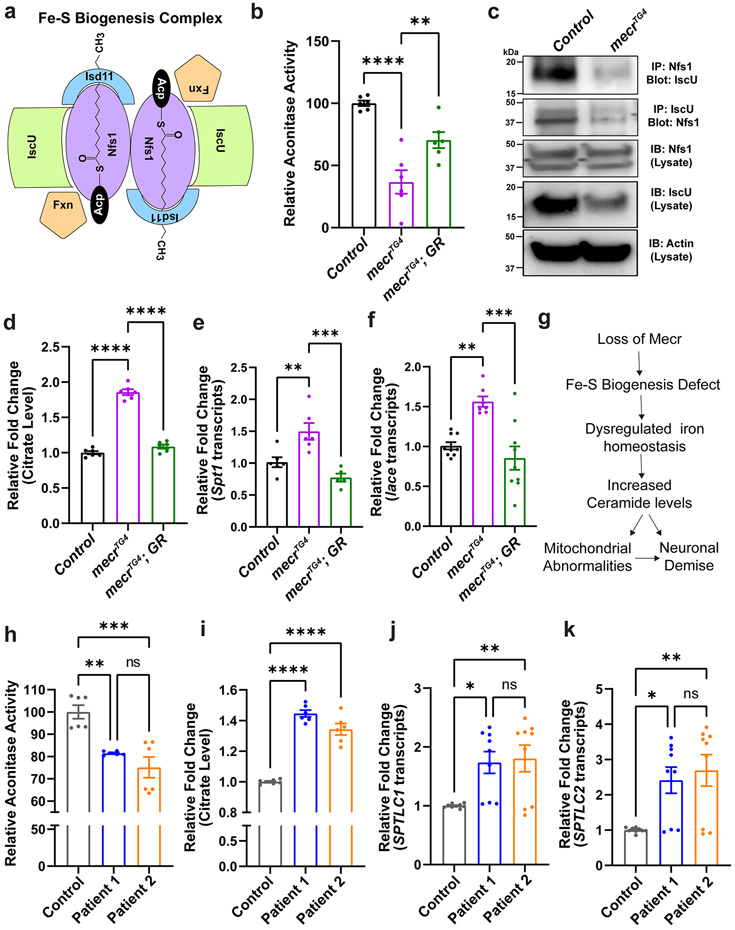
Figure 8: Loss of mecr/MECR reduces aconitase activity and promotes ceramide synthesis.
(a) Diagram of the proteins of Fe-S biogenesis complex. (b) Relative aconitase activity in mecrTG4 mutants. Each dot represents the values from three experiments with two independent sets of biological replicates (n = 50 2nd instar larva). (c) The interaction between Nfs1 and Iscu in mecrTG4 mutants is reduced. (d) Relative citrate levels in the mecrTG4 mutants. Each dot represents the values from three independent experiments (n = 50 2nd instar larva). (e-f) Relative fold changes in the transcript levels of Spt1 and lace in mecrTG4 mutants. Each dot represents the values from two (for Spt1) or three (for lace) independent experiments. (g) Proposed mechanism of neurodegeneration upon loss of mecr. (h) Relative aconitase activity in the fibroblasts from patients and parental control. Each dot represents the values from two independent experiments. (i) Relative citrate levels in patient-derived fibroblasts. Each dot represents the values from three independent experiments. (j-k) Relative fold changes in the transcript levels of SPTLC1 and SPTLC2 in patient-derived fibroblasts. Each dot represents the values of replicates from three independent experiments. For statistical analyses between two samples, two-tailed Student’s t test, and for three samples, one-way ANOVA followed by a Tukey’s post-hoc test are carried out. Error bars represent SEM (*p < 0.05; **p < 0.01; ***p < 0.001; ****p < 0.0001).

