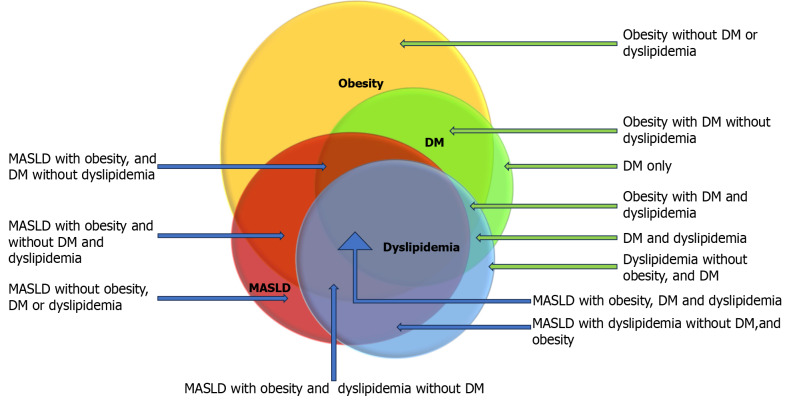
Figure 1.
Overlap of metabolic comorbidities. This diagram shows a hypothetical overlap of metabolic risk factors to highlight the heterogeneity of metabolic overlap. Metabolic risk factors are represented with colors: Obesity; yellow, DM; green, dyslipidemia; blue and metabolic dysfunction-associated steatotic liver disease (MASLD); red. The proportion of overlaps were based upon the data from epidemiological studies. Blue arrow represents MASLD patients and green arrow represents non-MASLD patients but has metabolic risk factors. MASLD: Metabolic dysfunction-associated steatotic liver disease; DM: Diabetes mellitus.

