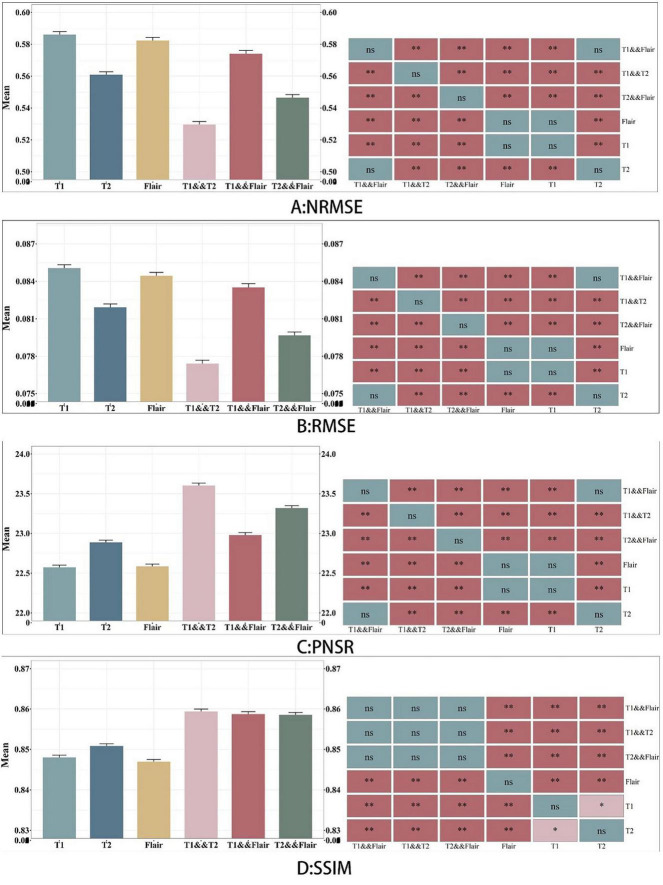
FIGURE 4.
Comparison between six sets of models. A, B, C and D represents the four evaluation indicators of NMSE, RMSE, PSNR and SSIM. The figure on the left represents the average value of the test data, and the graph on the right indicates whether there is a significant difference between the models, where NS represents no significant difference.

