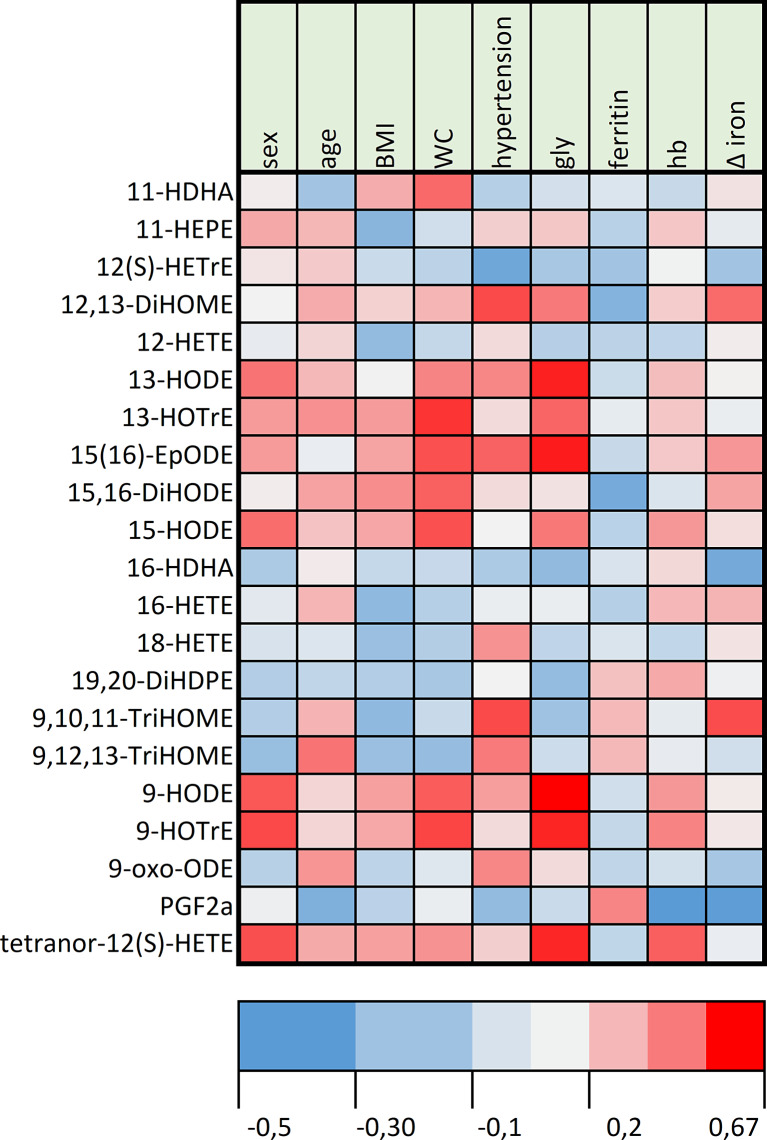
Fig. 5.
Heatmap correlation analysis (Spearman’s rho) of oxylipin variations with metabolic parameters after the iron meal challenge in HH. The correlation between the oxylipin level, metabolic parameters, and serum iron variations after the meal at 180 min was assessed by Spearman’s rank correlation coefficient. The color intensity represents the degree of correlation. Blue indicates negative correlations, and red indicates positive correlations. Light gray indicates the absence of correlation. BMI, body mass index (kg.m-2); gly, fasting venous glycaemia; hb, hemoglobin at the inclusion visit; WC, waist circumference (cm); Δ iron, serum iron increase at 180 min after meal consumption.

