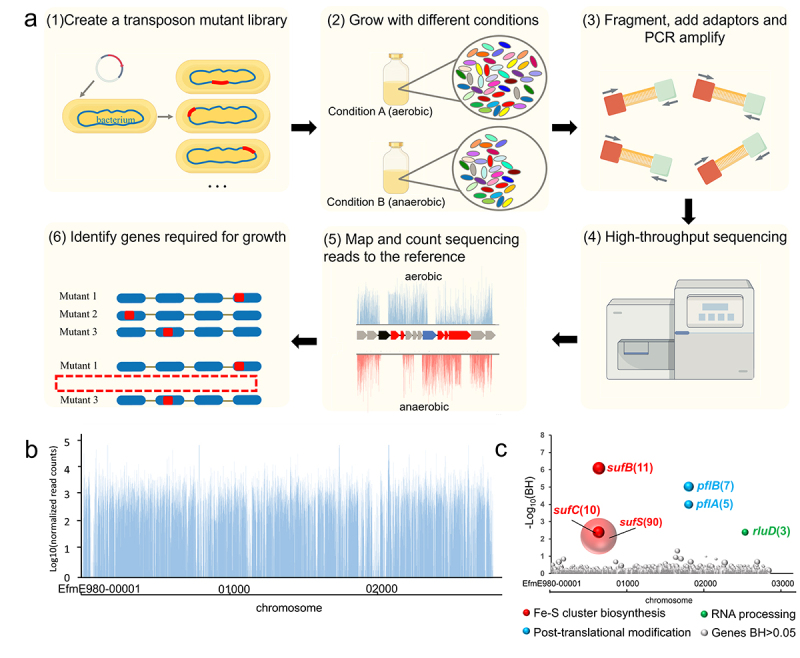
Figure 1.

Tn-seq analysis for identification of functional genes under anaerobic conditions in E. faecium.
(a) Schematic depiction of Tn-seq data. (b) In the control group, transposon insertion sites and insertion numbers at different sites and the presence of transposon insertions in 2702 genes within the E980 genome of E. faecium are indicated by blue lines. (c) Identification of functional genes implicated in resistance to anaerobic conditions through Tn-seq analysis. Distinct bubbles denote distinct genes, with bubble sizes corresponding to fold changes. Fold changes increase as the size of the bubble increases. The x-axis represents genomic position of genes on the chromosome, while y-axis represents outcome of statistical analysis of Tn-seq data. Genes exhibiting a significant change (BH < .05) in growth between anaerobic treatment and aerobic treatment groups are grouped by function and are labeled with different colors, and name and change in abundance between the control conditions and growth in anaerobic treatment group are indicated next to the bubbles in parentheses, while remaining genes are represented in gray.
