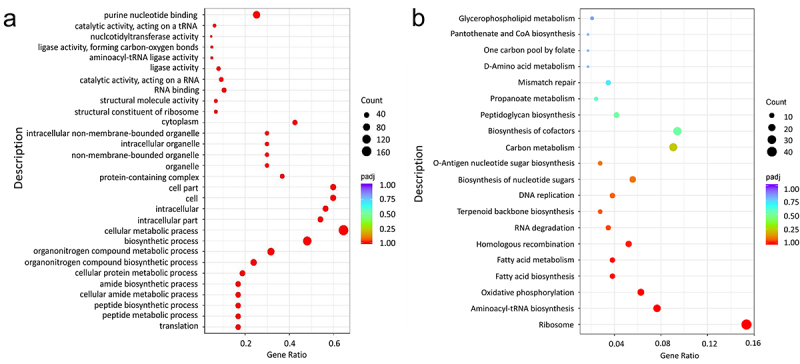
Figure 2.

Essential gene of GO (a) and KEGG (b) enrichment analysis.
The enriched biological pathways are shown on the y-axis, and Gene Ratio was defined as the ratio of the number of DEGs annotated to GO term or on KEGG pathway to the total number of genes on the x-axis.
