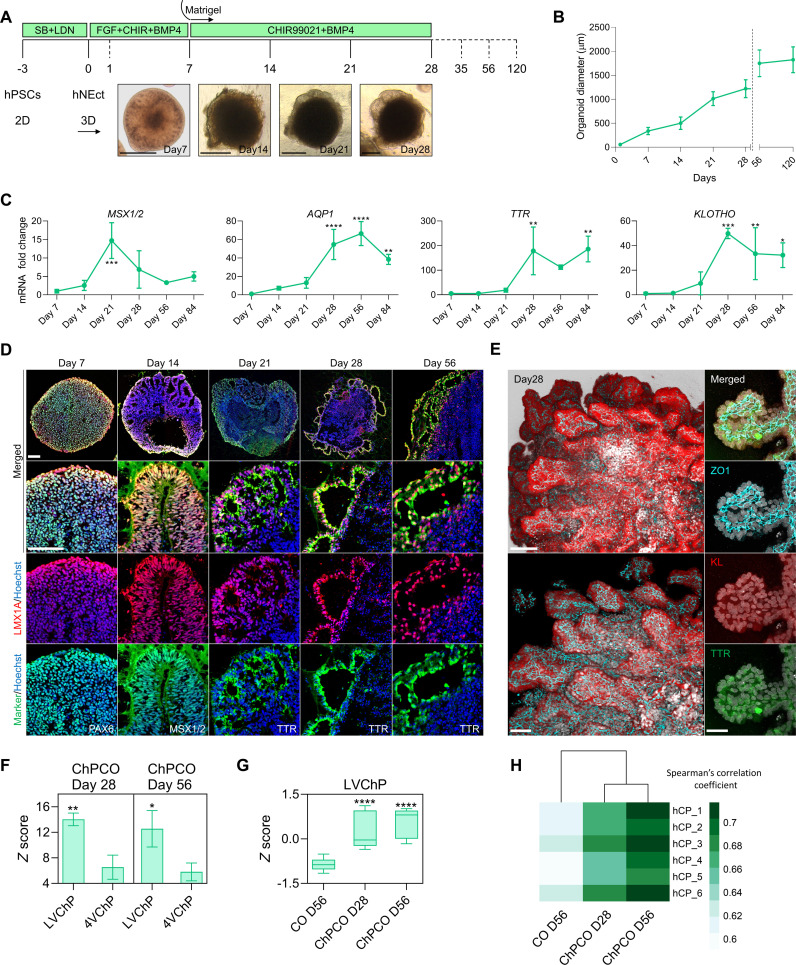
Fig. 1. Generation of human self-organizing multiple ChPCOs in 3D from neuroectoderm.
(A) Schematic representation of the strategy used to generate ChPCOs from hPSCs. Below brightfield images showing the developmental stages of ChPCO overtime in vitro. Scale bar, 500 μm. (B) Graph showing ChPCO growth in vitro. Data are presented as means ± SD. N = 13; total organoids N = 156 summarized in table S8. (C) qRT-PCR of MSX1/2, AQP1, TTR, and KLOTHO. Values were normalized to GAPDH levels and expressed relative to day 7 values. Data are means ± SD; n = 4. *P < 0.05, **P < 0.01, ***P < 0.001, ****P < 0.0001 via one-way analysis of variance (ANOVA). (D) Immunostaining of section organoids showing the protein expression of PAX6 (green), LMX1A (red), MSX1/2 (green), LMX1A (red), TTR (green), and LMX1A (red) and counterstained with Hoechst 33342 (blue). Scale bar, 72 μm. (E) Whole-mount immunostaining of ChPCO on day 42 of differentiation. Left images showing the multiple ChP-like epithelia stained with KLOTHO (red) and ZO1 (cyan), Scale bar, 110 μm. Right images are 100× magnification of a single ChP-like epithelium stained with ZO1 (cyan), KLOTHO (red), and TTR (green), Scale bar, 30 μm. (F) Graph representing the average z score per column (pool of three replicates), showing distribution of genes for LVChP and 4VChP obtained from bulk RNA-seq. Data are presented as means ± SD. *P < 0.05, **P < 0.01 via Student’s t test. (G) Box blot showing distribution of marker genes for LVChP obtained from bulk RNA-seq of ChPCOs and COs. Data are presented as minimum to maximum. ****P < 0.0001 via one-way ANOVA. See fig. S2E for individual genes used. (H) Heatmap comparing the Spearman correlation coefficient of the bulk RNA-seq of ChPCOs and COs to adult human ChP obtained from 44- to 70-year-old donors (104).

