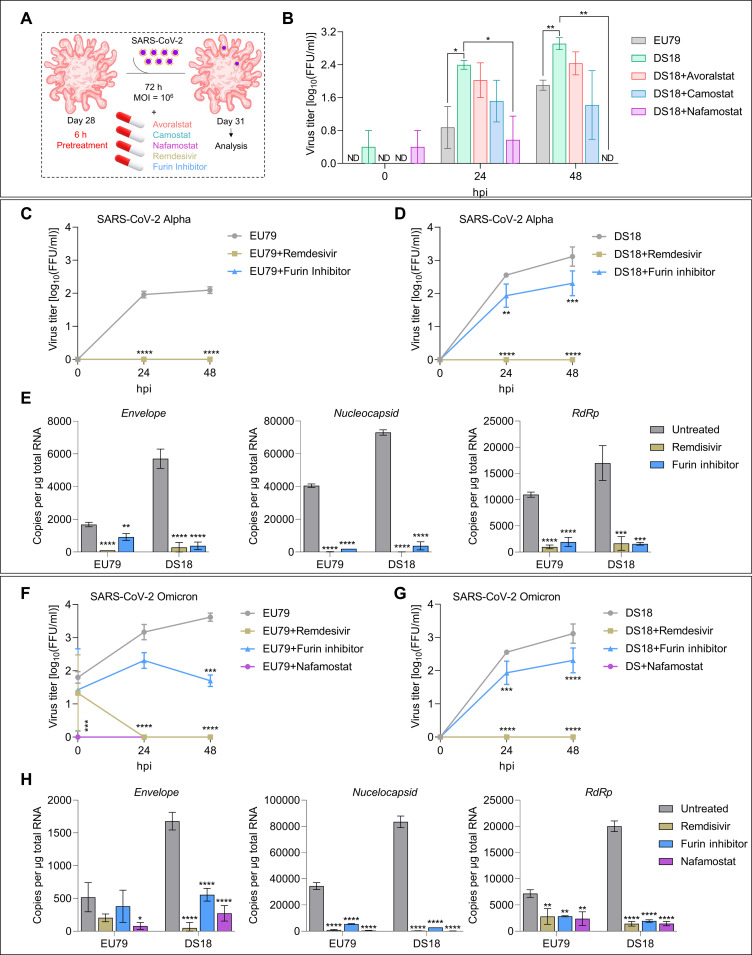
Fig. 10. Drug screening of FDA-approved inhibitors against TMPRSS2 activity in ChPCOs.
(A) Diagram of the SARS-CoV-2 infection protocol. Remdesivir was added immediately after infection and for 72 hours during infection. (B) Quantification of viral titers from infected ChPCO supernatants treated with 100 μM TMPRSS2 inhibitors. Data are means ± SEM. *P < 0.05, **P < 0.01 via Student’s t test. N = 20; organoid number = 60 summarized in table S8. (C) Quantification of viral titers from infected ChPCO supernatants treated with 50 μM furin inhibitor and 100 μM remdesivir. Data are means ± SEM. N = 3 summarized in table S8; ****P < 0.0001 via two-way ANOVA. (D) Quantification of viral titers from infected ChPCO supernatants treated with 50 μM furin inhibitor and 100 μM remdesivir. Data are means ± SEM. N = 3 summarized in table S8; **P < 0.01, ***P < 0.0001, ****P < 0.0001 via two-way ANOVA. (E) Graphs showing the SARS-CoV-2 Envelop, nucleocapsid, and RdRp in ChPCOs on day 31. Data are means ± SD. **P < 0.01, ****P < 0.0001 via one-way ANOVA. N = 3 summarized in table S8. (F) Quantification of viral titers from infected ChPCO supernatants treated with 50 μM furin inhibitor, 100 μM remdesivir, and 100 μM nafamostat. Data are presented as means ± SEM. N = 3 summarized in table S8. ***P < 0.0001, ****P < 0.0001 via two-way ANOVA. (G) Quantification of viral titers from ChPCO supernatants treated with 50 μM furin inhibitor, 100 μM remdesivir, and 100 μM nafamostat after SARS-CoV-2 Omicron (106 FFUs) infection. Data are means ± SEM. N = 3 summarized in table S8. ***P < 0.001, ****P < 0.0001 via two-way ANOVA. (H) Graphs showing the SARS-CoV-2 Omicron genes Envelop, nucleocapsid, and RdRp in EU79 and DS18 ChPCOs on day 31. Data are means ± SD. *P < 0.05, **P < 0.01, ****P < 0.0001 via one-way ANOVA. N = 3 summarized in table S8.

