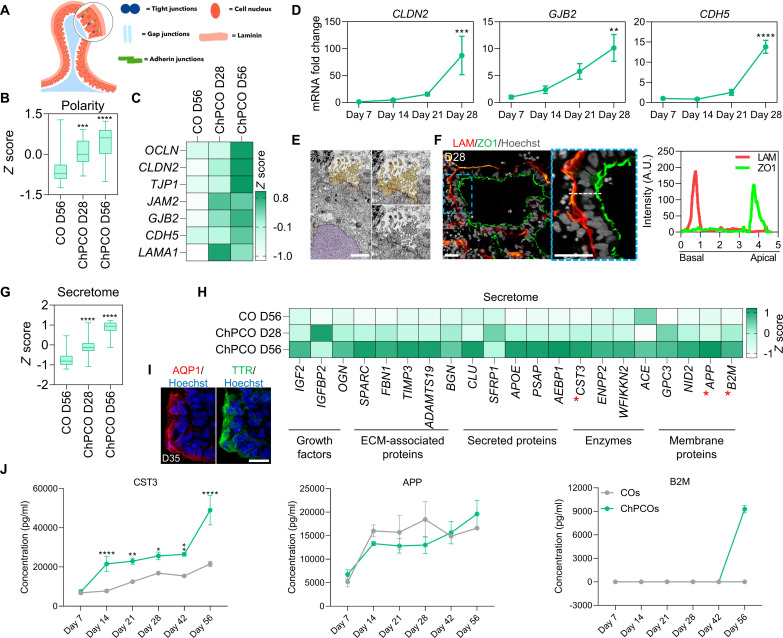
Fig. 2. Development and functional analysis of ChP-like epithelium in ChPCOs.
(A) Schematic diagram outlining the apicobasal polarity of ChP. (B) Box blot showing distribution of polarity genes [listed in (C) and fig. S3A] obtained from bulk RNA-seq. Data are minimum to maximum. ***P < 0.001, ****P < 0.0001 via one-way ANOVA. (C) Heatmap of representative apicobasal polarity genes within bulk RNA-seq. Values are shown as z score. (D) qRT-PCR of apicobasal polarity genes in ChPCOs. All values were normalized to GAPDH and expressed relative to day 7 values. Data are means ± SD. **P < 0.01, ***P < 0.001, ****P < 0.0001 via one-way ANOVA. N = 3. (E) TEM of ChPCOs on day 28 showing the high density of mitochondria, tight junction at the apical side, microvilli (light brown), and nucleus (light purple). Scale bar, 250 nm. (F) ChPCO sections stained with LAMININ (red) and protein ZO1 (green) and counterstained with Hoechst 33342. Scale bar, 20 μm. Dotted white line represents the average intensity of LAMININ and ZO1 expression along the apicobasal of ChP-like epithelium plotted in the graph. (G) Box blot showing distribution of CSF secretome genes [listed in (H)] obtained from bulk RNA-seq. Data are presented as minimum to maximum. ****P < 0.0001 via one-way ANOVA. (H) Heatmap of CSF secretome genes obtained from bulk RNA-seq. Values are z score. Red asterisks represent the genes selected for ELISA experiment shown in (J). (I) ChPCO sections immunostained with water channel aquaporin 1 (AQP1) in red and TTR in green in ChP-like epithelium and counterstained with Hoechst 33342. Scale bar, 20 μm. (J) Luminex multiplex/ELISA showing CSF secretome protein markers in medium of ChPCOs. Data are shown as means ± SD; N = 3. *P < 0.05, **P < 0.01, ****P < 0.0001 via one-way ANOVA.

