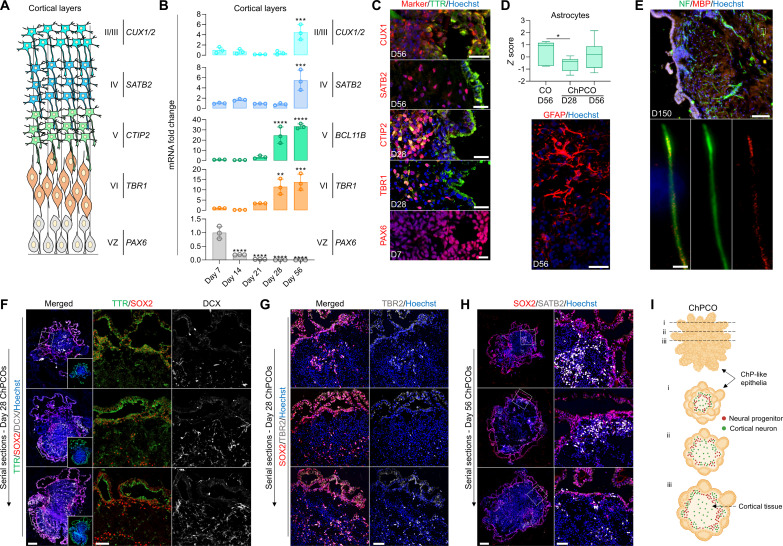
Fig. 4. ChPCOs contain cortical neurons with progress maturation over time in culture.
(A) Diagram of the development of the cortical plate layers: VZ is ventricle zone. (B) qRT-PCR of ventricular zone gene PAX6 and cortical neuronal layer genes (TBR1, CTIP2, SATB2, and CUX1/2). All values were normalized to GAPDH and expressed relative to day 7 values. Data are means ± SD; **P < 0.01, ***P < 0.001, ****P < 0.0001 via one-way ANOVA. N = 3. (C) Immunostaining of ChPCO sections showing PAX6 (red), TBR1 (red), CTIP2 (red), SATB2 (red), and CUX1 (red) and counterstained with Hoechst 33342. Scale bars, 10 μm (PAX6), 20 μm (TBR1, CTIP2, and SATB2), and 30 μm (CUX1). (D) Box blot showing distribution of astrocyte genes (listed in fig. S4B) obtained from bulk RNA-seq. Data are presented as minimum to maximum. *P < 0.05 via one-way ANOVA. Below image shows ChPCO section immunostained with GFAP (red) and counterstained with Hoechst 33342. Scale bar, 30 μm. (E) Immunostaining of ChPCO section showing myelinated neurons marked by neurofilament (green) and MBP (red) and counterstained with Hoechst 33342 (blue). Scale bar, 100 μm. Dotted white box indicates zoomed images below. Scale bar, 2 μm. (F) Immunostaining of serial sections of ChPCO showing DCX (gray), SOX2 (red), and TTR (green). Scale bar, 200 μm. Dotted square white box indicates zoomed images with scale bar = 50 μm. (G) Immunostaining of serial sections of ChPCO showing TBR2 (gray) and SOX2 (red). Scale bar, 50 μm. (H) Immunostaining of serial sections of ChPCO showing SATB2 (gray) and SOX2 (red). Scale bar, 200 μm. Dotted square white box indicates zoomed images with scale bar = 50 μm. (I) Schematic diagram outlining the architectural structure of ChPCO with neural compartment.

